After several years of waiting (precisely 7), the new IPCC report is finally out!
The Working Group I (WGI) report addresses the most up-to-date physical understanding of the climate system, bringing together the latest advances in climate science since the Fifth Assessment Report (AR5) publication (WG1 in 2013) and its associated Special Report 1.5 (SR1.5). It combines data references from paleoclimatology with observations, process explanations, as well as global and regional climate simulations.
Let’s end the suspense: the news is not really great. We were already aware of that, but now, it is written in 3,949 pages. However, Human-induced climate change causes irreversible impacts and some that can still be limited.
This article will focus on the Summary for Policymakers (SPM), which is only 42 pages long. Whether you are sensitive to climate issues or not, I can only give you one piece of advice: read this summary! If everything goes well, you should not stay indifferent to the world’s situation and will want to find out more, and even find solutions.
This matter will be addressed in three sections. First, the take-home messages. Then, a more detailed analysis of certain aspects referenced with reliable sources for further in-depth study. Finally, a critical analysis of the report and the media coverage of its release.
Preface
Before you read more, it is essential to be aware of what IPCC is, how authors are selected to write the report, how scientific papers are selected, who finances it, etc. If you know it already, good for you; otherwise, read this summary.
As Christophe Cassou recalls, this first report provides the most up-to-date physical understanding of the climate system and climate change. The second one will pinpoint the impacts, adaptation, and vulnerability of human societies and ecosystems to climate change, and the last one will address global solutions to implement to limit climate change and its impacts. Working Groups II and III must approve their respective reports by February and March 2022. The Synthesis Report is expected by the end of September 2022.
What to remember from this first report:
- The report is a summary of 14,000 scientific papers. The 269 Lead Authors responded to 78,007 comments from governments and experts (!!!!). The Summary for Policymakers (SPM) was validated, sentence by sentence, by governments (we will come back to this later).
- 3 versions are available:
- the Summary for Policymakers (SPM, 42 pages)
- the Technical Summary (TS,159 pages)
- the Full Report (FR, 3,949 pages).
Tip: read the summary, several times, if necessary, as well as the technical summary, if possible. The full report should be used as an encyclopedia > to go into a thematic in-depth. Naturally, feel free to read it entirely…
- The IPCC provides calibrated language to estimate the likelihood of a single event or an outcome (indicated in italic in the reports, as described in AR5):
- Virtually certain (99-100% probability)
- Very likely (90-100% probability)
- Likely (66-100% probability)
- About as likely as not (33 to 66% probability)
- Unlikely (0-33% probability)
- Very unlikely (0-10% probability)
- Exceptionally unlikely (0-1% probability)

It is important to realize the sacrifices involved in writing an IPCC report. Scientists work voluntarily, very often in their private time, and spend sleepless nights to produce a report of the highest possible quality and accessible to everyone, particularly through the SPM and the TS.
The last two weeks of plenary meetings were long and intense, as shown in this photo by one of the authors, Peter Thorne, who obviously spent some nights in his office.

Thank you all. Our respect is huge.
Key points of the new IPCC report
Before diving into some of the points, here are the main findings of the new IPCC report (SPM + TS). First time? Make sure you are sitting comfortably:
Current Climate Situation
- It is unequivocal that human influence has warmed the atmosphere, ocean, and land. Widespread and rapid changes in the atmosphere, ocean, cryosphere, and biosphere have occurred.
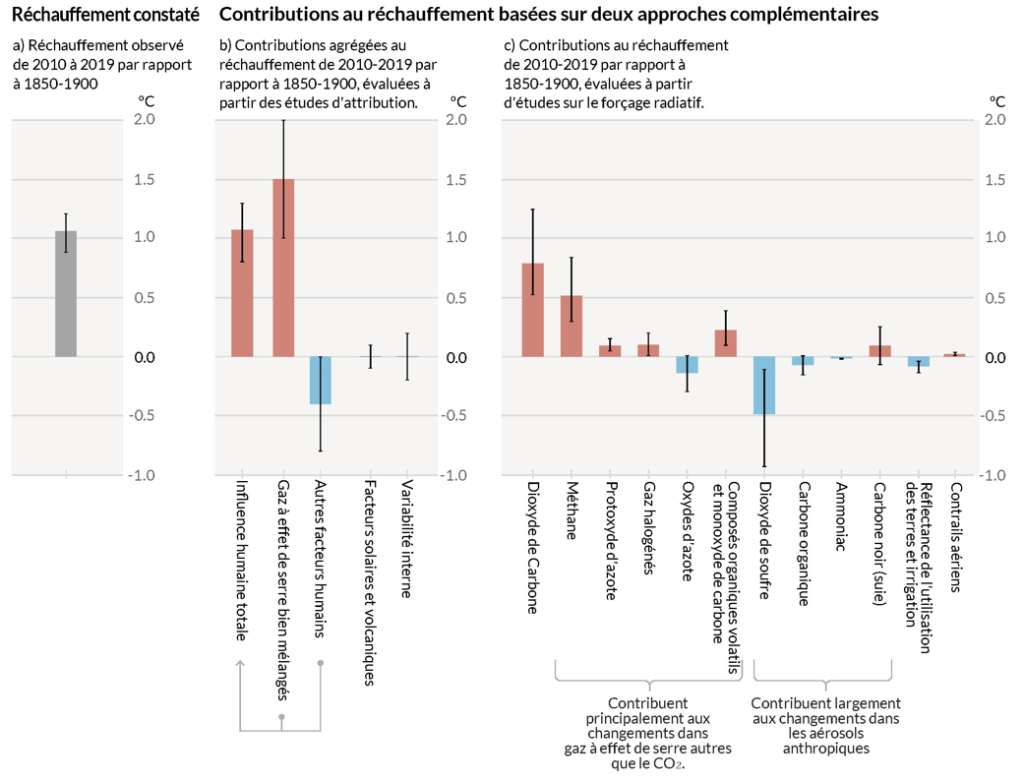
- Human influence is 100% responsible for climate change. It is now an unequivocal fact (to understand what radiative forcing is, read this article). We can observe it by comparing the observed warming (a) and human influence (b):
- The scale of recent changes across the climate system as a whole – and the present state of many aspects of the climate system – are unprecedented over many centuries to many thousands of years.
- The global mean sea level has risen faster since 1900 than over any preceding century in at least the last 3,000 years (high confidence).
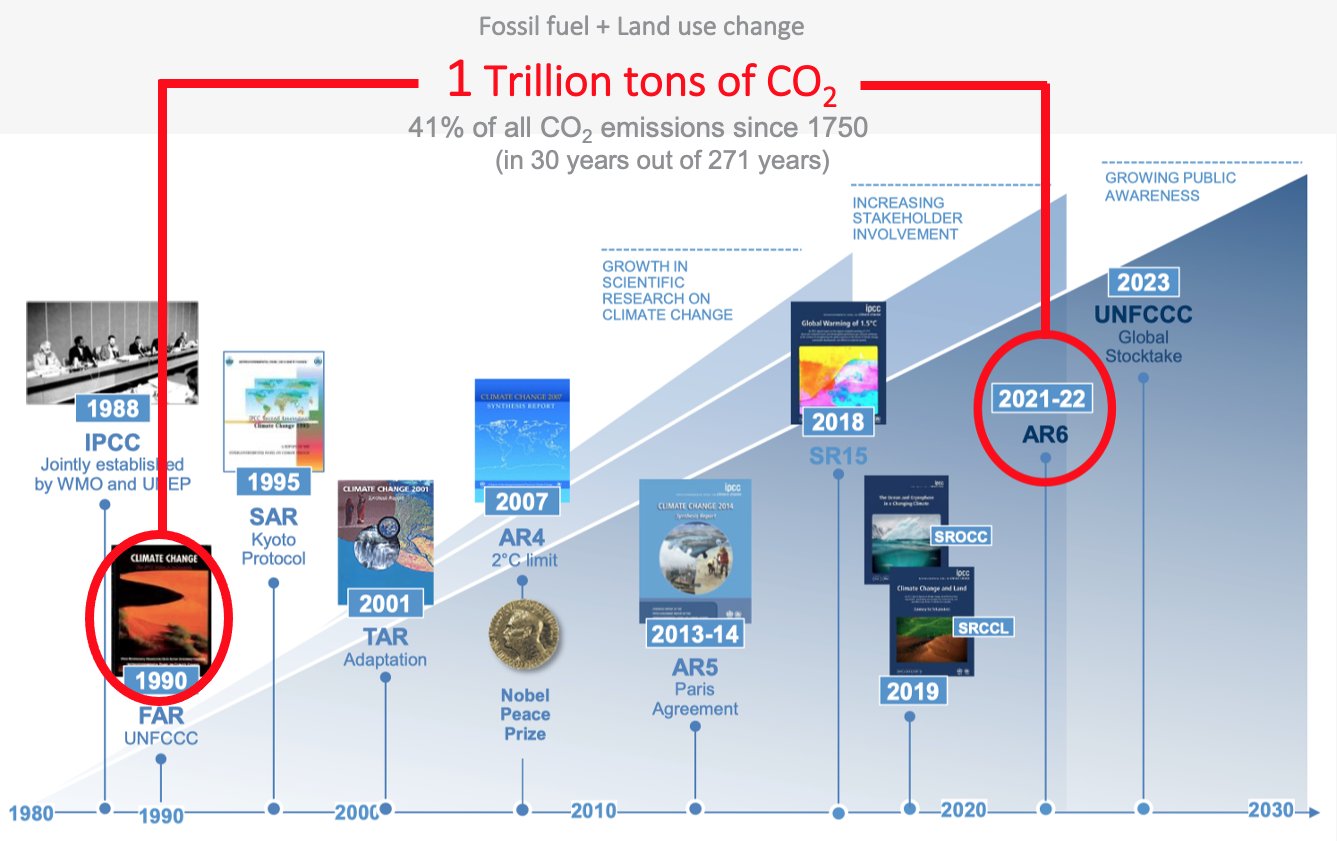
- Since the publication of the first IPCC report in 1990, 1,000 billion tonnes of CO2 were emitted. This represents almost half of the emissions since the beginning of the industrial era.
- Human influence has warmed the climate at a rate that is unprecedented in at least the last 2000 years. Recent climate change events have increased in frequency and intensity and have become global. The last 10 years have been 1.1°C warmer than 1850-1900.

- Human-induced climate change is already affecting many weather and climate extremes in every region across the globe. Evidence of observed changes in extremes such as heatwaves, heavy precipitation, droughts, and tropical cyclones, and, in particular, their attribution to human influence, has strengthened since the Fifth Assessment Report (AR5).
- Improved knowledge of climate processes, paleoclimate evidence and the response of the climate system to increasing radiative forcing gives a best estimate of equilibrium climate sensitivity of 3°C, with a narrower range compared to AR5.
Possible Climate Futures and their Impacts
- Under scenarios with increasing CO2 emissions, natural land and ocean carbon sinks are projected less effective at slowing the accumulation of CO2 in the atmosphere
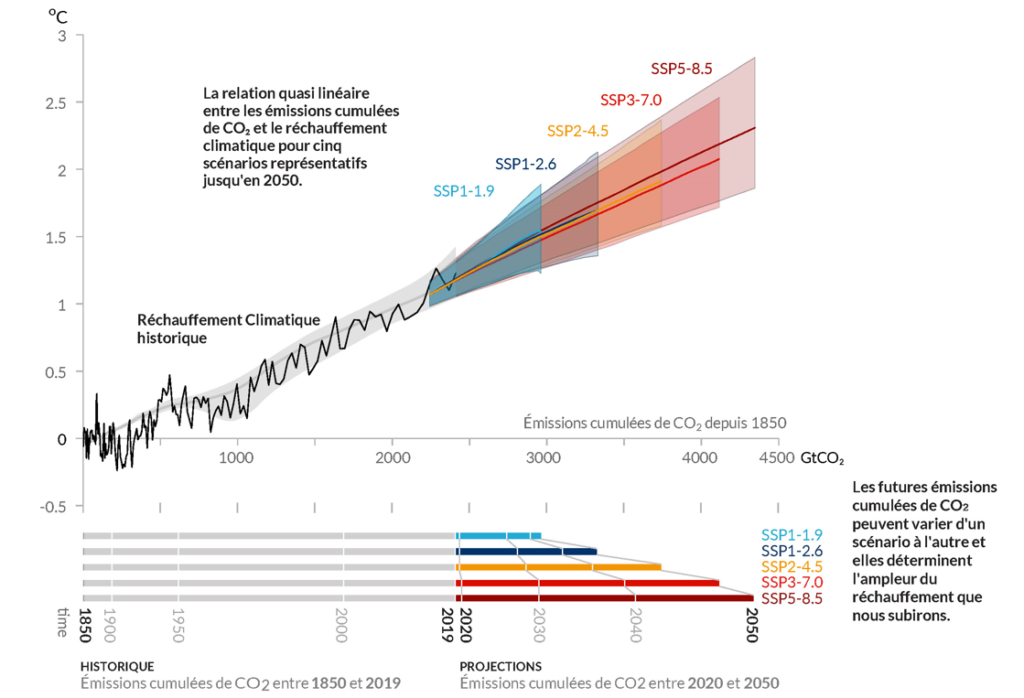
- The IPCC described projected global temperature change according to 5 illustrative emissions scenarios, referred as socio-economic pathways (SSP)
- Under 4 out of 5 GHG emissions scenarios (with the exception of the lowest, SSP1-1.9), global warming of 1.5°C relative to 1850-1900 would be exceeded in the near term (2021 – 2040) and will be maintained by the end of the 21st century.
- As warming continues, each region could experience more extreme weather events, sometimes cascading, with multiple consequences. This is more likely to happen at global warming of +2°C than +1.5°C, and even more at higher warming levels. Understand “cascading” as multiple simultaneous risks (e.g., heatwave, followed by a wildfire that occurred in Canada in June 2021)
- Tipping points are included in the report as, although they have a lower probability of occurring, they could have devastating consequences. Low-likelihood outcomes, such as ice-sheets collapse, abrupt ocean circulation changes (e.g., AMOC), certain compound extreme events, and warming substantially larger than the assessed “very likely” range of future warming, can not be ruled out and are part of risk assessment.
- Mountain and polar glaciers are committed to continuing melting for decades or centuries. Loss of permafrost carbon following permafrost thaw is irreversible at centennial time scales.
Limiting Future Climate Change
- Limiting human-induced global warming requires strong, rapid, and sustained reductions in CO2, methane, and other GHGs. This will not only limit the impacts of climate change but will also improve air quality.
- Limiting global warming to +1.5°C will only be achievable if an immediate and large-scale reduction of GHG emissions is exectued. (See the different emissions scenarios)
- If global net negative CO2 emissions were to be achieved and be sustained, the global CO2-induced surface temperature increase would be gradually reversed (higher confidence than in previous report)
- But other GHG emissions-induced climate changes would be irreversible for decades, to millennia, for instance, changes in the oceans, ice sheets, and sea levels. Still, some changes could be slowed down, even stopped, by limiting global warming.
- Estimated of the remaining carbon budget – a simplified way of assessing how much CO2 can be released before a given level of warming is reached – have been improved since previous reports, but the carbon budget remains broadly unchanged.
Clarification on specific points of the new IPCC report
During the days following the release of the IPCC report, there was a lot of discussion about some of the points in the report, and sometimes a lot of approximations and even errors. This is normal. Such subjects are highly complicated and complex; and when this is not your area of expertise, it is nearly impossible to master all the concepts.
Therefore, here are some clarifications on some points of the new report. All these points deserve a substantial amount of work, both in terms of understanding and popularisation. Of course, the following points are only a non-exhaustive list (4,349 pages!). You will find articles on each topic on Bon Pote, including our serial articles in collaboration with the CNRS ‘Climate myths‘. If this article doesn’t exist yet, don’t worry: it is surely coming!
Equilibrium Climate Sensitivity
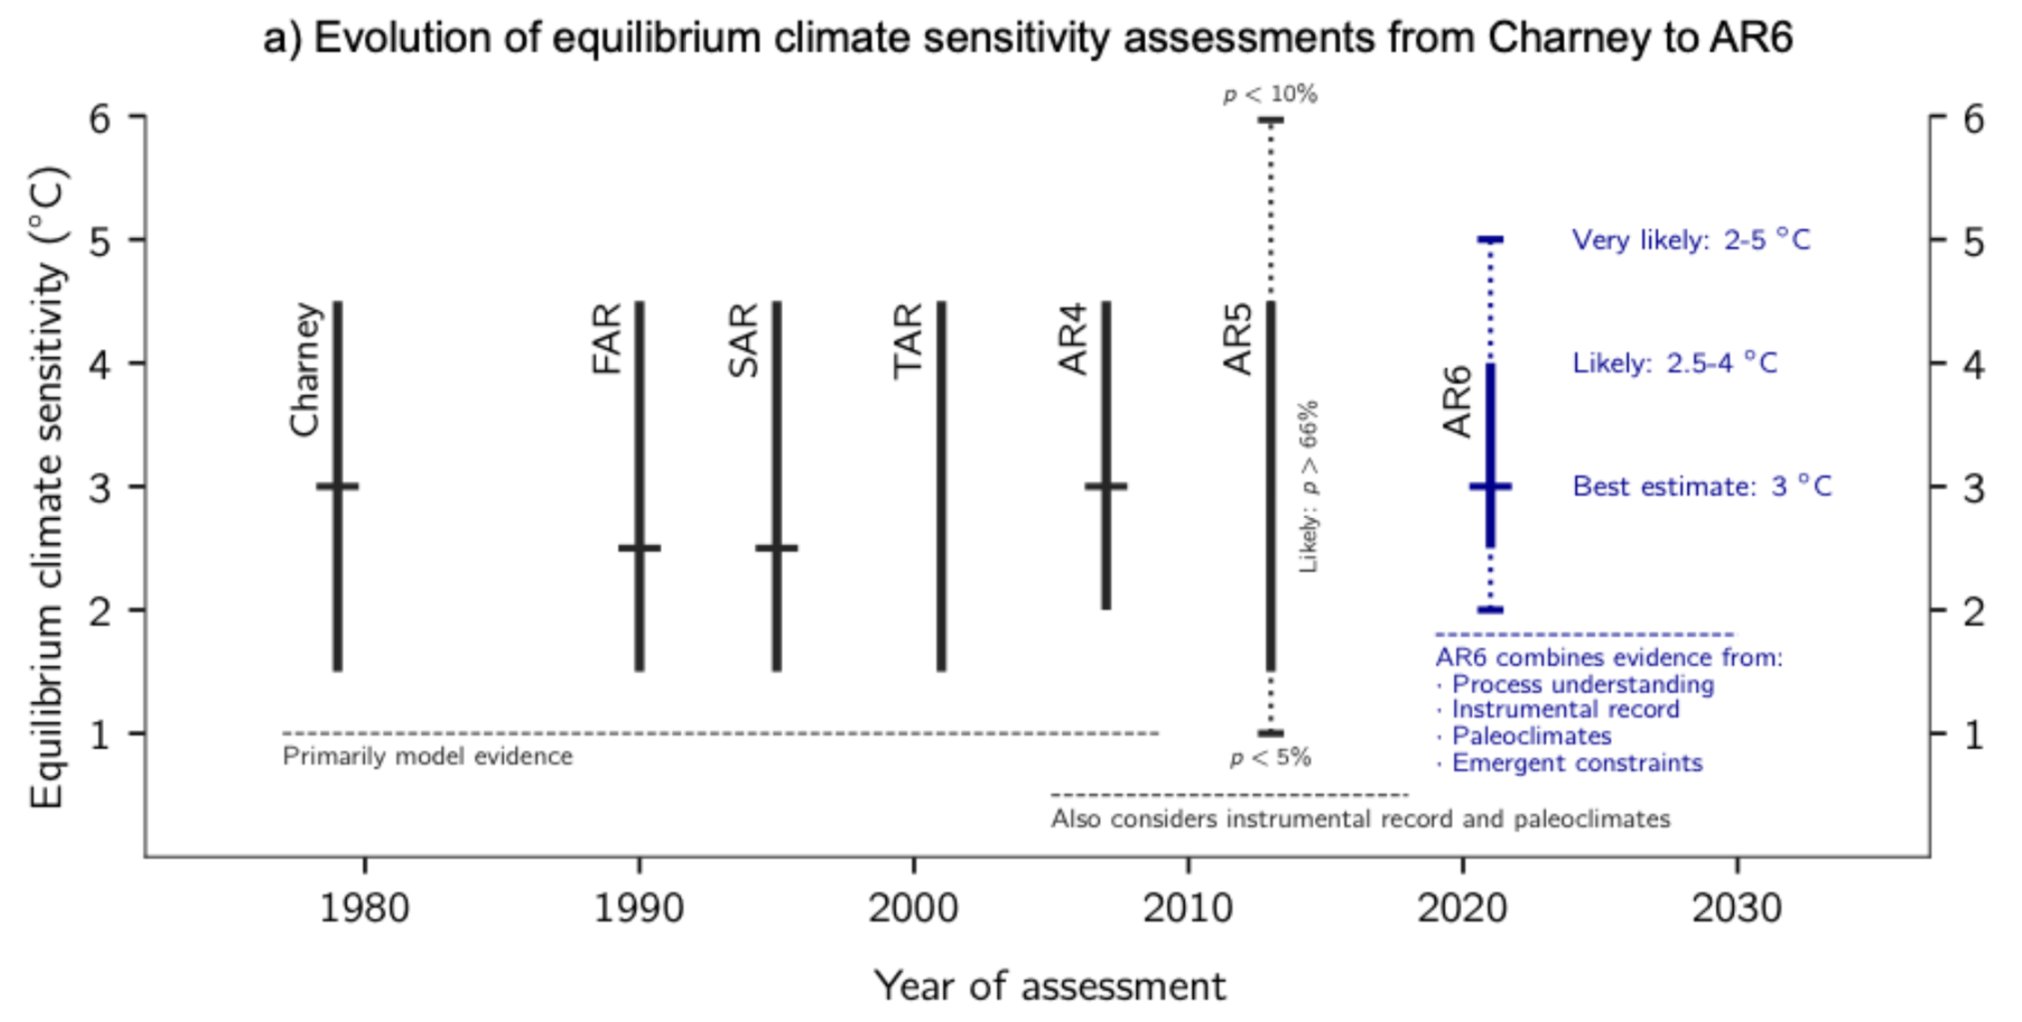
Equilibrium Climate Sensitivity (ECS) is (roughly) a measure of how much the world can be expected to warm for a doubling of CO2 above pre-industrial levels. This is a very important topic, as it provides us a better idea of our climate future.
We are now observing a narrowing of the range of climate sensitivity. This new report assessed a “likely” (67% probability) range of equilibrium climate sensitivity between 2.5°C and 4°C, that being a 50% reduction in uncertainty compared to AR5. The “very likely” range (~90% probability) of the AR6 is between +2°C and +5°C, compared to +1°C to +6°C in the AR5:
This new narrower range of values is both good and bad news. On one hand, it means that the probability of global warming of +5 or +6°C is “very unlikely”. On the other hand, it also means that we are saying goodbye to a +1°C world. The half-empty glass.
Figure TS.6 illustrates the likelihood for equilibrium climate sensitivity (ECS), the concepts of low-likelihood and global warming levels, the observed and projected changes in global temperature, and the associated impacts:

To go deeper into the topic, I recommend the following 2 articles: An Assessment of Earth’s Climate Sensitivity Using Multiple Lines of Evidence and an article on the extreme events that cannot be ruled out.
Are we going to reach +1,5°C of global warming 10 years earlier?
The answer is: not really. In this great article from Realclimate.org, we learn that it is mostly a question of methodology.”In summary, when apples are compared to apples (i.e. best estimates of scenario-based exceedance times), then the SR1.5 and AR6 provide remarkably consistent numbers: 2034.5 versus 2035“. This is important, and the authors of the paper warn against the possible exaggeration of the media, as the reality is not very exciting (i.e., no surprise, the figures are online!).
All scenarios predict that the planet will warm by 1,5°C
All SSP scenarios predict that the planet will warm by 1,5°C. The most ambitious emissions scenario predicts that 1.5°C will be reached in the 2030s, followed by a transient temperature peak of +1.6°C, before the global surface temperature would decline back to +1.4°C by the end of the century.
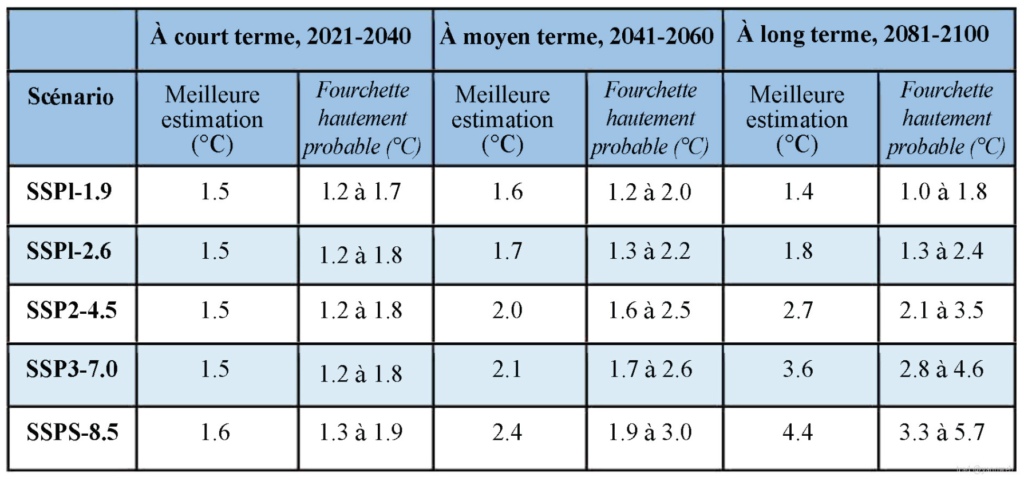
NB: when examining the SSP1-1.9 scenario, it requires a huge reduction in GHG emissions during the 21st century. The “carbon budget” estimated by the IPCC to limit global warming to +1.5°C is about 500 GtCO2. However, the SSP1-1.9 scenario emits 700 GtCO2 during the 21st century, which largely overshoots the remaining carbon budget. At the same time, it deploys 430 GtCO2 of negative emissions.
Tweet of Zeke Hausfather: “Relying on negative emissions allows the scenario to have a more plausible emissions reductions pathway; a similar scenario not using any net-negative emissions would likely require getting to global net-zero emissions in the 2040s.”
The problem is, we know that the technologies needed to reach negative emissions of these orders of magnitude do not exist, or haven’t been tested at this scale yet (we will come back to this later). The IPCC Working Group 3 report to be published early next year will assess the realism of the different scenarios.
What about the remaining carbon budgets?
“Carbon budget” can have different meanings. In general, it indicates how much CO2 could still be emitted while keeping warming below a specific temperature level.
The very good news is that, since AR5, estimates of remaining carbon budgets have been much improved. Now, we know that the increase in global surface temperature is almost linear to cumulative CO2 emissions (Figure SPM.10)
The Carbon Budgets for the different additional global warming are also integrated into the SPM. Table SPM.2 provides an overview of the latest estimates, for different temperature limits and probabilities of limiting global warming to these limits :
Analysis of Carbon Budgets
Analysis of Joeri Rogelj, expert on the topic since 10 years, Lead Author of SR15 and the new IPCC report (AR6) :
- Carbon budget estimates in AR6 are very similar to those published in the 1.5C Special Report in 2018, but they represent a significant update since AR5 in 2013.
- When adjusting for the emissions since AR5 and SR15, AR6 remaining carbon budget for limiting warming to 1.5C with 50% chance is about 300 GtCO2 larger than in AR5, but virtually the same as in SR15.
- Between SR1.5 and AR6 every piece of the carbon budget was reassessed:
- warming up-to-date (with all tonnes of GHG emitted)
- how much warming we get per tonne of CO2
- how much warming would occur once we reach net zero CO2
- how much non-CO2 warming we expect
- Earth system feedback otherwise not covered
Altogether these updates mean AR6 remaining carbon budget estimates are very similar compared to SR1.5.
To go further on the above-mentioned points, here is an explanation. Short version: remaining carbon budgets are low, our current annual emissions of about 40 GtCO2 quickly decrease them, and without immediate and fast reduction of the emissions, we will skyrocket the carbon budgets (and will overshoot +1.5°C and +2°C temperature limits).

Extreme Events Attribution Studies
Very significant progress has been made since the last IPCC report on the attribution. Science is the reason why we can attribute an extreme weather event to climate change. We have already talked about this in every article on (canicules, cyclones ou sécheresses, par ex). Here is what the IPCC tells us:
Human-induced climate change is already affecting many weather and climate extremes in every region across the globe.. Evidence of observed changes in extremes such as heatwaves, heavy precipitation, droughts, and tropical cyclones, and, in particular, their attribution to human influence, , has strengthened since AR5.
It is likely that the global proportion of major (Category 3–5) tropical cyclone occurrence has increased over the last four decades
Bring home message:
- It is no longer necessary to talk in general terms about the influence of climate change on all events; we can estimate the extent to which, for example, a particular heat wave has been intensified by human activity (see also the works of the World Weather Attribution)
- For the first time, the IPCC describes an observed increase in extreme events for hurricanes. Previously, these changes were too uncertain to achieve international consensus. Extreme weather events are now measurably worsening in all parts of all continents(with the exception of southern South America, where data were too sparse).
Here is a great infographic that expresses the projected changes in frequency and intensity of extreme events according to the different global warming levels:

NEWSLETTER
Chaque vendredi, recevez un condensé de la semaine, des infographies, nos recos culturelles et des exclusivités.
+30 000 SONT DÉJÀ INSCRITS
Une alerte pour chaque article mis en ligne, et une lettre hebdo chaque vendredi, avec un condensé de la semaine, des infographies, nos recos culturelles et des exclusivités.
Regionality of Climate Change
IPCC really focused on the regional impacts of climate change. As we know, global warming of +2°C will definitely not affect equally all regions of the world.
The following infographic gives an overview of which regions will be affected by extreme weather events and with what degree of confidence:

The IPCC also points out that “Natural drivers and internal variability will modulate human-caused changes, especially at regional scales and in the near term, with little effect on centennial global warming“. These modulations are important to take into account when planning for all possible changes, including risk management. We already discussed this in the article about Fidji Islands.
With the two temperatures put forward by the IPCC (+2°C and +4°C), we can see that the Earth is not warming up in the same way everywhere. This is one of the elements of climate justice, a topic highlighted in the Working Group 2 report which will be available in early 2022.
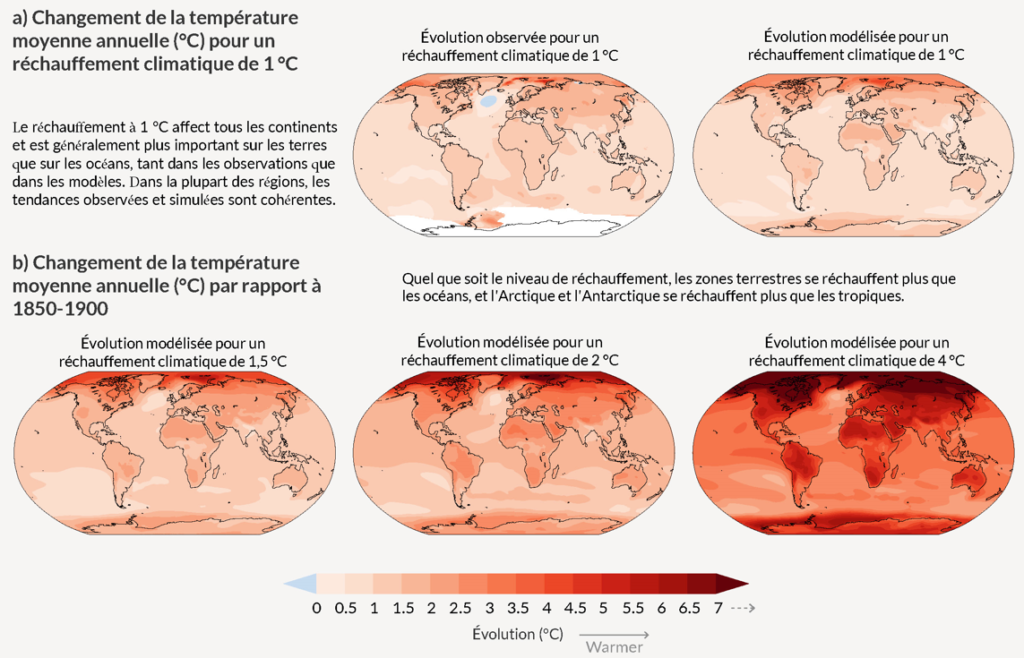
Bonus: the IPCC provides an interactive atlas, which I recommend, this is very striking. And also this tool from a collaboration between the IPCC and NASA to explore local sea-level projections, with a breakdown of the causes of sea-level rise.
FAQ – Quick question, quick answer
- Why was the report released on 9 August? -> the release of the report was delayed by 3 months because of the Covid pandemic. That was not a global conspiracy, as I have read: to release it in the middle of August, “conveniently”. Please be aware that negotiations at COP26 will take place in advance, and that this report will be conclusive. The sooner it is released, the better. Would you have preferred in September, right at the start of the school year?
- Why is there no +3°C scenario, or a scenario between SSP2-4.5 and SSP3-7.0 ? Some climate scientists and experts are asking the same question. Indeed, with the current promises from the States (NDCs), we are heading towards such scenarios. However this was a less prioritize scenario for the CMIP6 (climate model)
- There is a climatic inertia of 20 years, even 40 years! >It is WRONG. The IPCC just confirmed it in the report. “If we reduced emissions to zero tomorrow, the world would probably stop warming. The question of how fast we can realistically reduce emissions is a matter of politics and economics, not physical science,” says Zeke Hausfather, Author of this excellent review.
The last word
This new IPCC WPI report brings many confirmations, bad news… but also encouraging ones. No, “not everything is over, we all are not going to die“. We do have our climate future in our hands, it is up to us to drastically, quickly, and sustainably reduce our emissions.
I reiterate: everyone should at least read the Summary for Policymakers. Everyone should get familiar with it and then look deeper into the different subjects. Its conclusions are crystal clear, and accessible for everyone to understand. One sentence must absolutely catch your attention: every emitted tonne of CO2 adds to climate change. If you don’t know yet what actions impact climate change the most, I urge you to stimulate your carbon footprint.
Furthemore, it is the first time in history that a scientific report has, and will have so much importance, for the scientific, political, geopolitical, and economical communities. Its findings will be decisive for the upcoming negotiations at COP27, amongst others.
This will be discussed in the next articled dedicated to political (and media) analysis of the release of this report, which has already stimulated much attention from.
READ THE REPORT OF THE SECOND IPCC WORKING GROUP (WG2)
Update: the article on media coverage, the reactions of politicians (and lobbies) is online !
A version especially for parents and teachers is also available!
As well, here is an article gathering the AR6 infographics.
Thanks to Jean-Baptiste Sallée, Lead Author of the new IPCC report, for the review
Thanks to Yann Rozier for the translation of the infographics (which will be updated once the IPCC releases a French version)
BONUS: INFOGRAPHICS
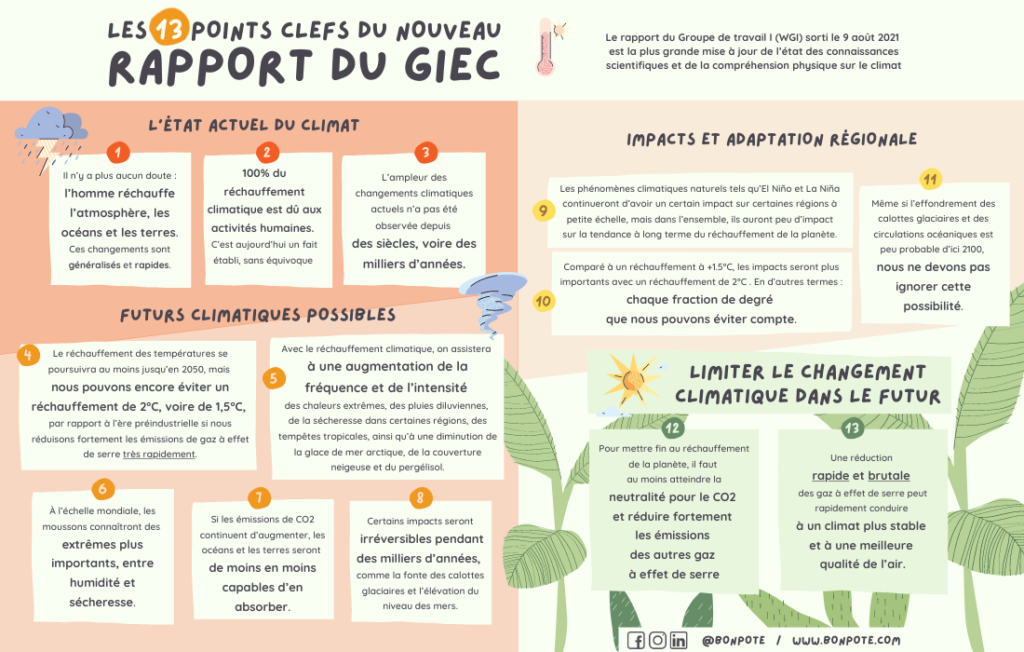
The content of the infographics below is the same. There are voluntarily several formats and colors, so that everyone can save/print what he or she prefers:
Translations into several languages are available here, and soon in PDF format for printing!
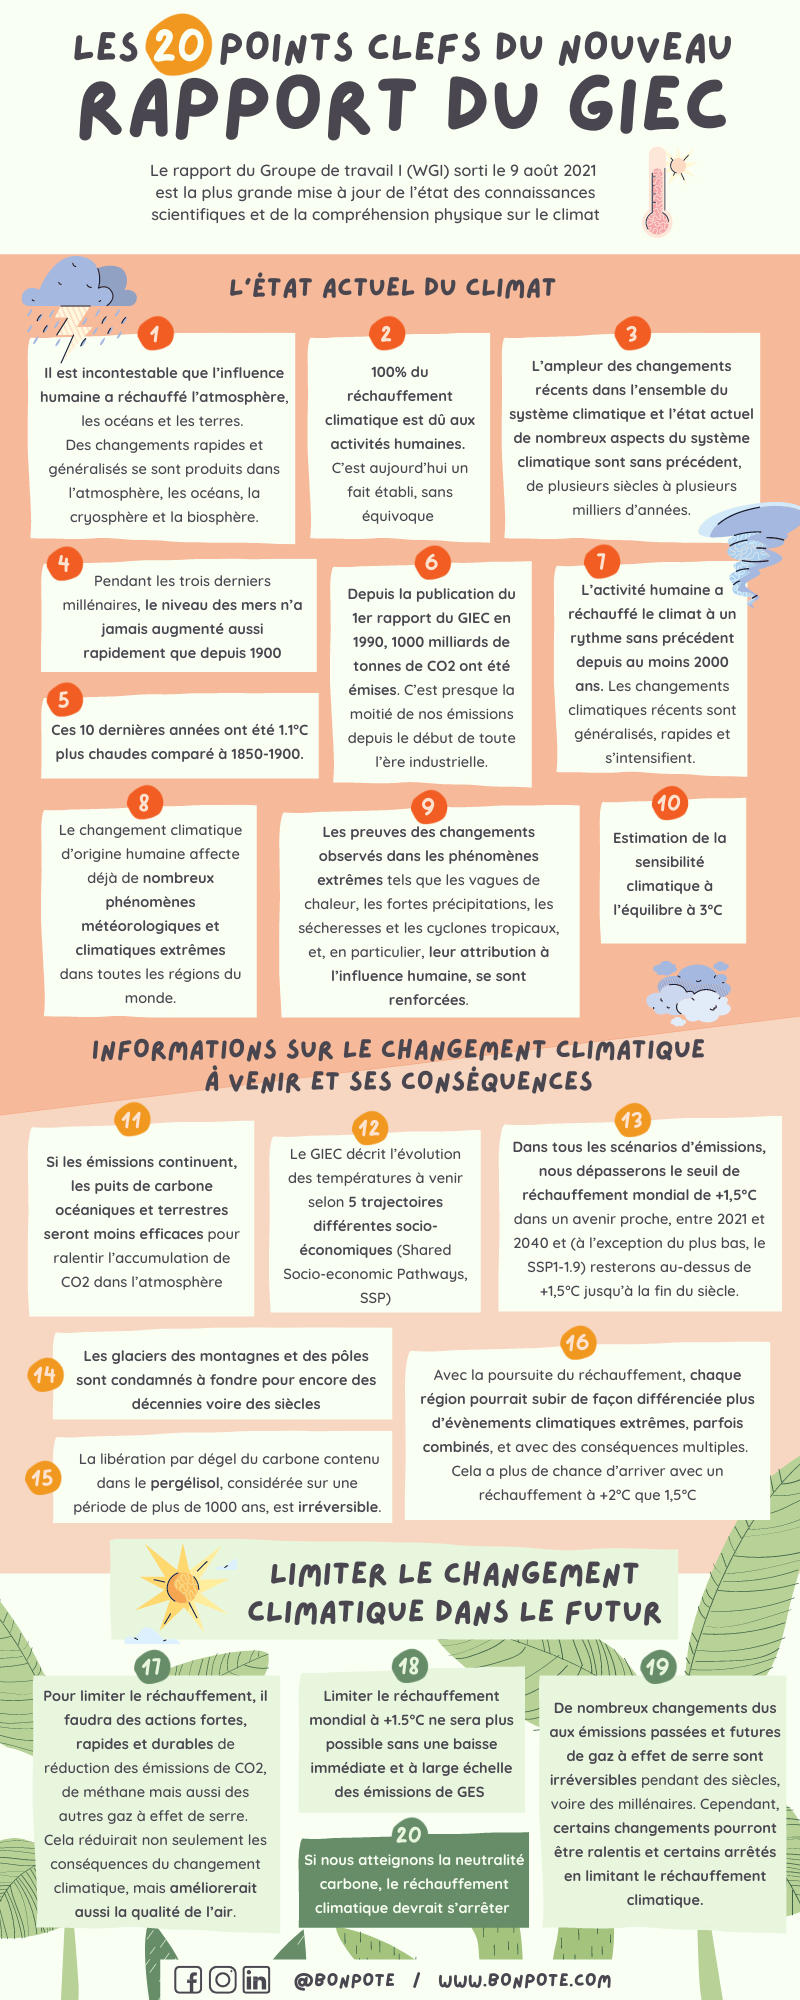
BONUS: 2 infographics of the 20 key points (same content, 2 different formats):







One Response
Hi Bon Pote!
Could you do the poster in English as well? I am trying to give to reach out to nonespeaking french colleagues 🙂
Thanks