So that they are not lost in the meanders of social media, you can now find all the IPCC infographics in this article!
They are very good complements to the articles and have many advantages:
- A quick read of the news: the essentials presented in a few ideas or figures
- They can be shared more easily, especially on social media.
- They can be printed (at the office, at home, etc.)
Some points to remember
- When they are published on social media, infographics are always accompanied by an explanatory text that allows (as far as possible) to give additional information that may not appear on the infographic
- An infographic, by essence synthetic, will never replace the content of an article (which itself is a synthesis of a subject, with several scientific articles or books as sources).
These infographics will also be available in the ‘Visuals’ drop-down menu on the Bon Pote homepage. If you want the ideas to spread, share these infographics!
NB: PLEASE CREDIT THE WORK WHEN USING THESE INFOGRAPHICS. If you enjoyed it and found it useful, you can support the work via Tipeee. The graphic work is among others realized by Sydney Thomas and reviewed by different authors of the IPCC reports.
Sommaire
Group 1 Infographics
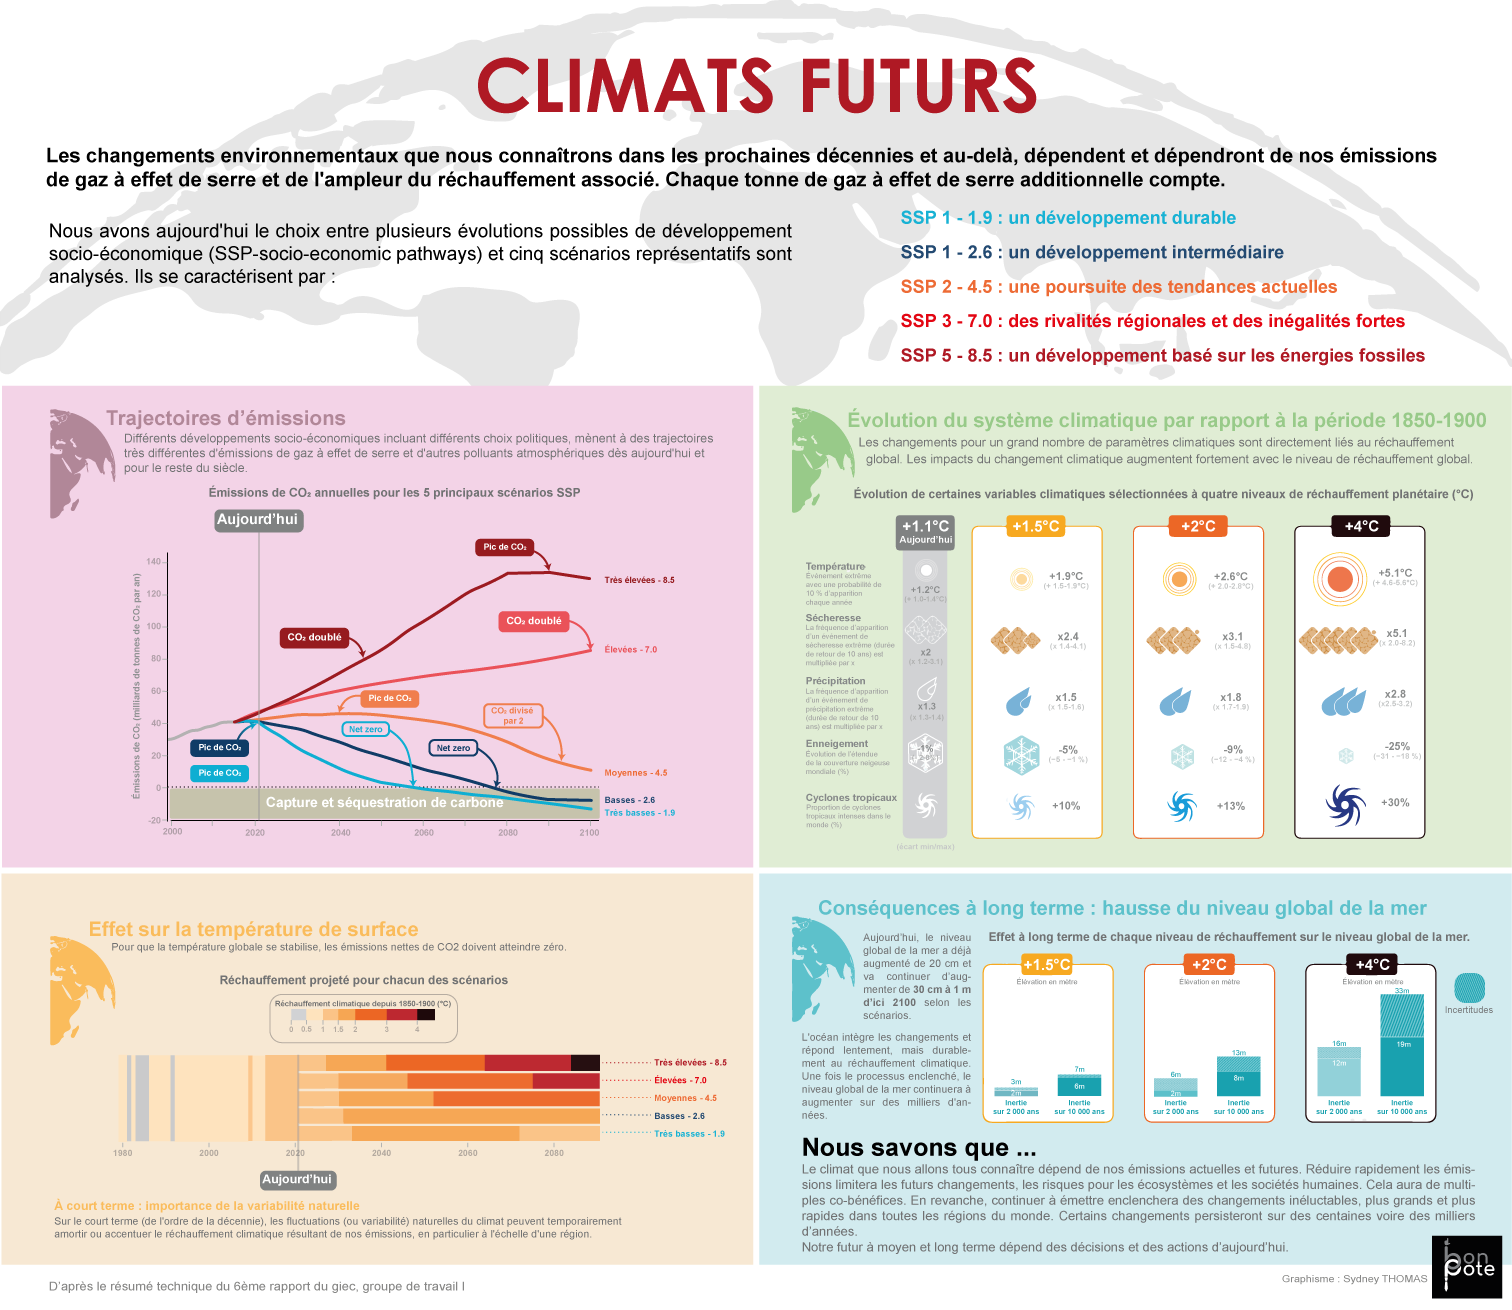
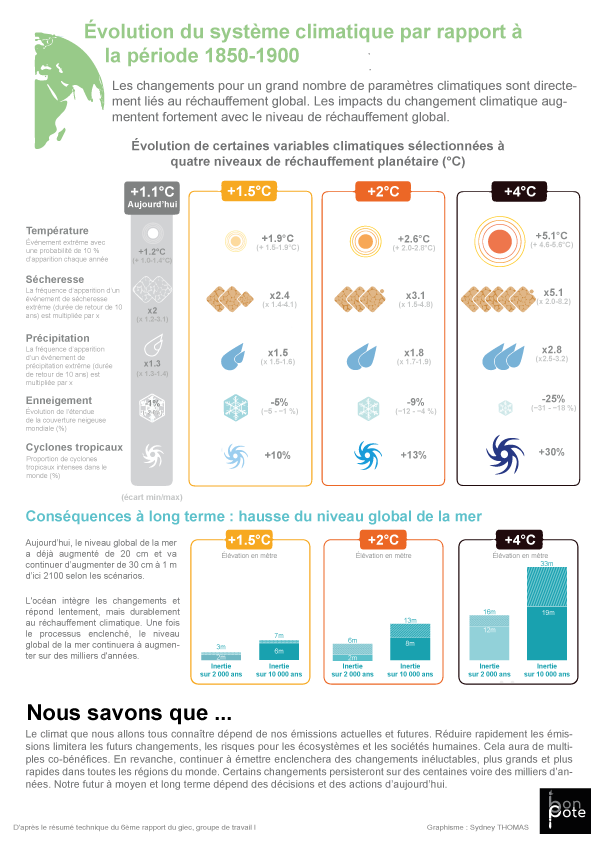
You can find an article summarizing the work of Group I here. The infographics below are all available in ‘Poster’ version for the best possible quality.
First infographic
The content of the infographics below is the same. There are voluntarily several formats and colors, so that everyone can save/print what he or she prefers:
Translations in several languages are available here!
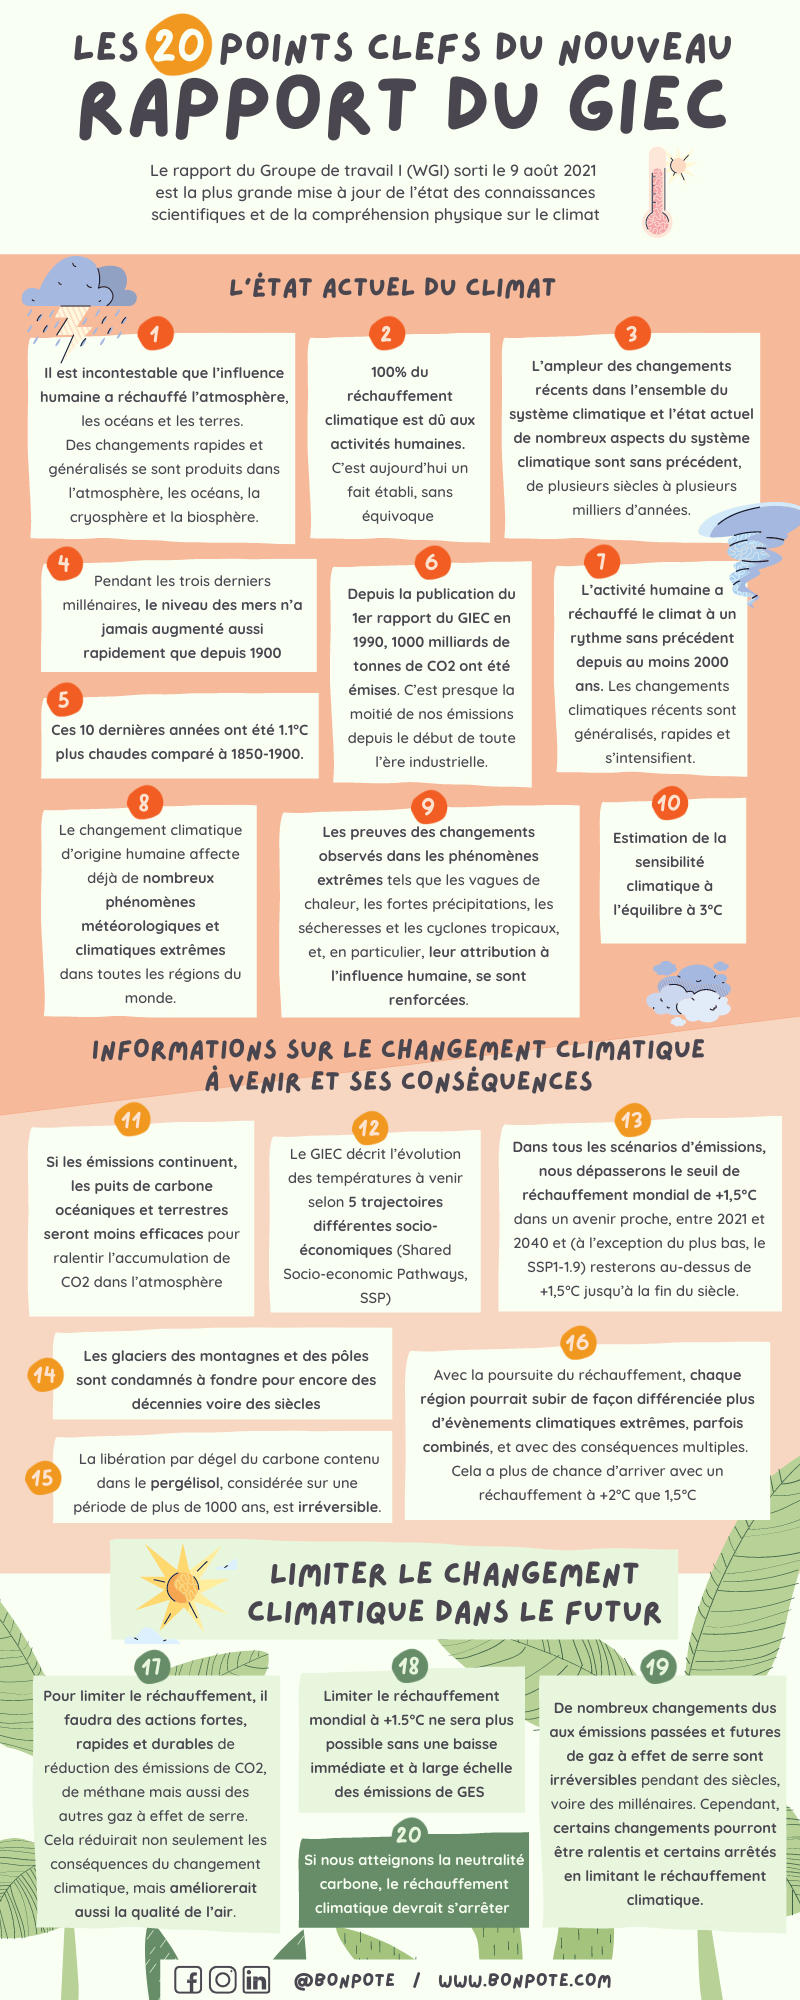
BONUS: 2 infographics of the 20 key points (same content, 2 different formats):


WORKING GROUP 2
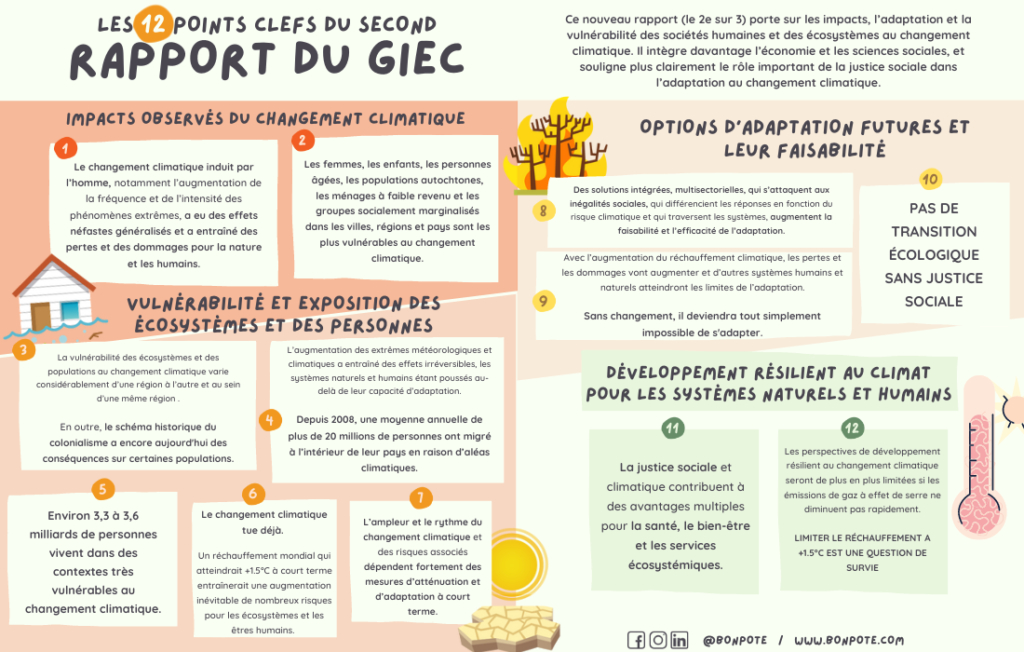
While the first report dealt with the physical understanding of the climate system and climate change, this new report (the 2nd of 3) focuses on the impacts, adaptation and vulnerability of human societies and ecosystems to climate change. Compared to previous versions, this report integrates more economics and social sciences, and more clearly emphasizes the important role of social justice in climate change adaptation.
Here is the summary of the report, and a 12-point infographic:
WORKING GROUP 3
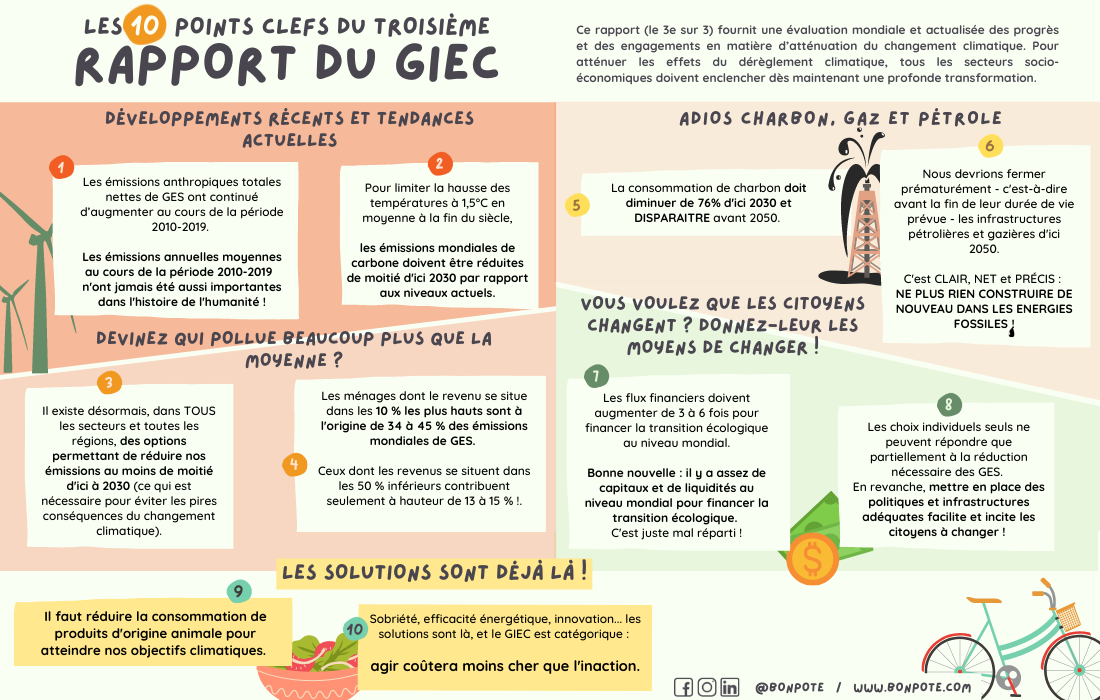
This report (the 3rd of 3) provides an updated global assessment of progress and commitments on climate change mitigation. To mitigate the effects of climate change, all socio-economic sectors must start a profound transformation now.
Here is the summary of the report, and a 10-point infographic: