
This is what Valérie-Masson Delmotte declared at the press conference for the release of the new IPCC Group 1 report on August 9, 2021:
“We would like for the entire report to contribute to improving climate knowledge worldwide, for it to be used globally in education, so that teenagers and students can acquire the latest and best knowledge available.”
Roger that!
An article has already been written to summarize the documents of the SPM (Summary for Policy Makers) and of the TS (Technical Summary). However, the vocabulary used in these syntheses is not always accessible. Indeed, in spite of the IPCC’s best communication efforts, the summaries can prove a bit difficult to read.
Hence this ‘general public’ version, which is what I would have liked to read when I first started. This version is meant to be accessible to everyone, regardless of one’s level of study. Teachers and professors will also be able to use this material, in order to explore these crucial subjects for our future with their pupils and students. It is the first time in history that a scientific report holds — and will continue to hold — such sway in the scientific, political, geopolitical and economic realms. This requires the attention of each and everyone, as well as a little bit of work to make it accessible…
This article is divided into three main sections:
- What is the IPCC
- The key takeaways from the report
- Analyzing climate change and its possible evolutions and consequences
Lastly, the article includes a bonus section featuring infographics, which you can save, share, print… anything you might need to get the message across!
Sommaire
1/ What is the IPCC
The Intergovernmental Panel on Climate Change (IPCC) was established in 1988 to provide comprehensive assessments of the state of scientific, technical and socio-economic knowledge about climate change, its causes, potential impacts and response strategies.
- The IPCC is not an association of individuals, but an association of countries: Its members are nations, not individuals. The people who sit in the IPCC assemblies only represent member countries.
- The IPCC is completely transparent, everything is available on the website: How the authors are selected, the documents they base their research on, how the reports are approved, etc.
- The IPCC is not a research laboratory. It is an organization that assesses and synthesizes the research that is produced in laboratories around the world.
- There are 3 main working groups and a Task Force:
- The first report (which is studied here) deals with the physical understanding of the climate system and of climate change.
- The second will address the impact of, and the adaptation and vulnerability of human societies and ecosystems to climate change
- The third will address global solutions to mitigate climate change and its effects . Groups 2 and 3 are scheduled to approve their reports in February and March 2022. The synthesis report is scheduled to be published in September 2022.
- The IPCC does not make recommendations, only projections.
- The IPCC synthesizes all scientific papers, provided that the research has been peer-reviewed in a scientific journal.
- Each line of the summary for policy makers is validated by a delegate, who represents a country
The key takeaways from the report
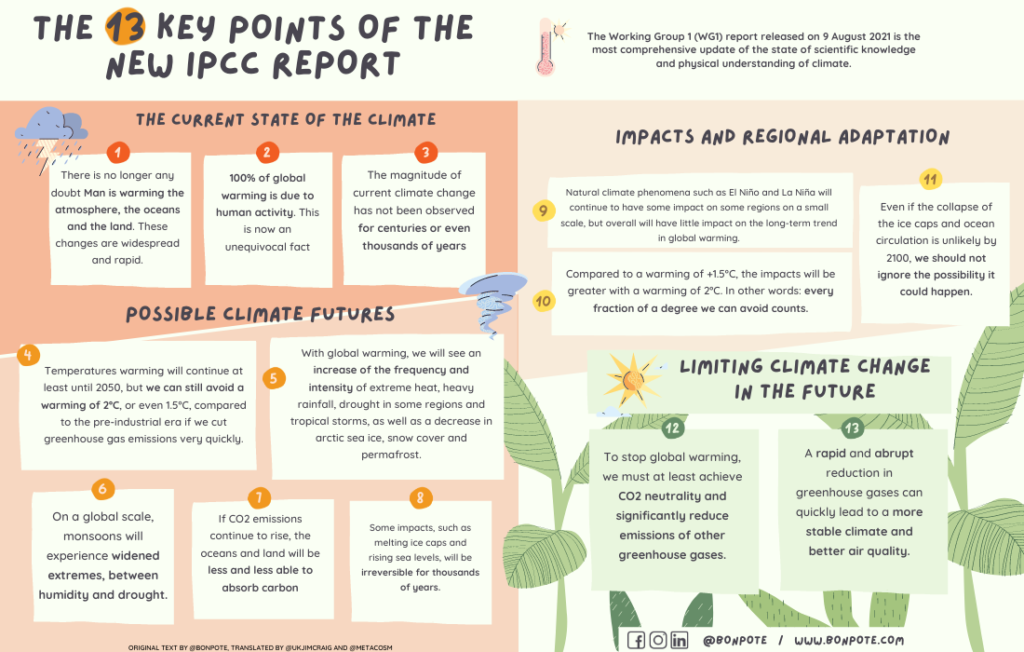
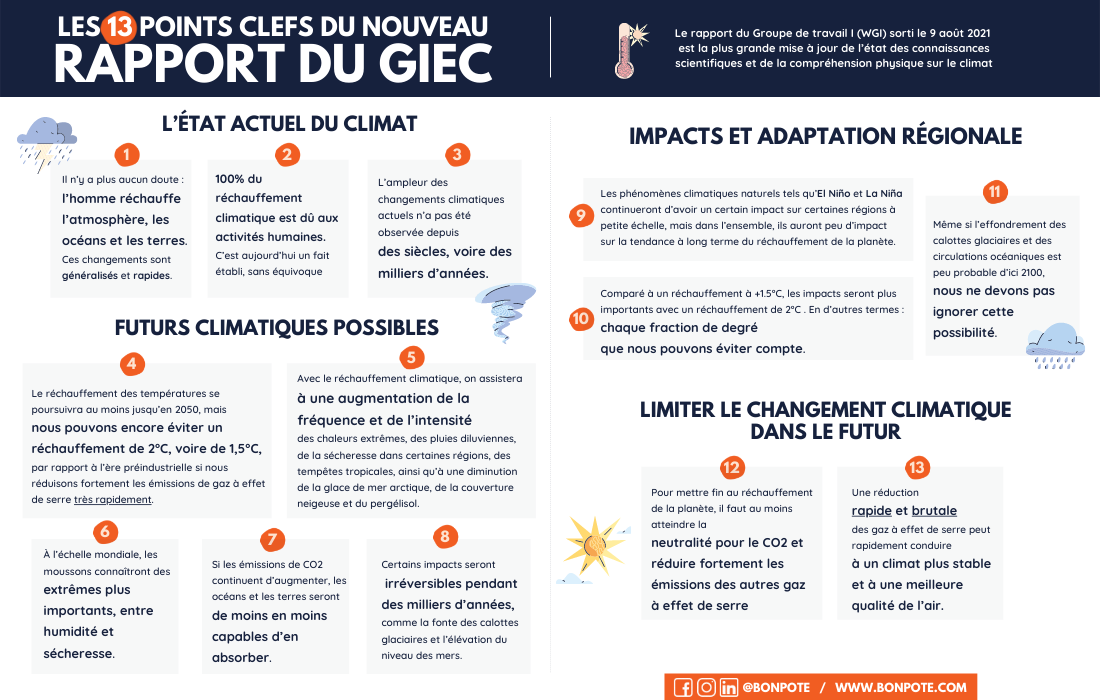
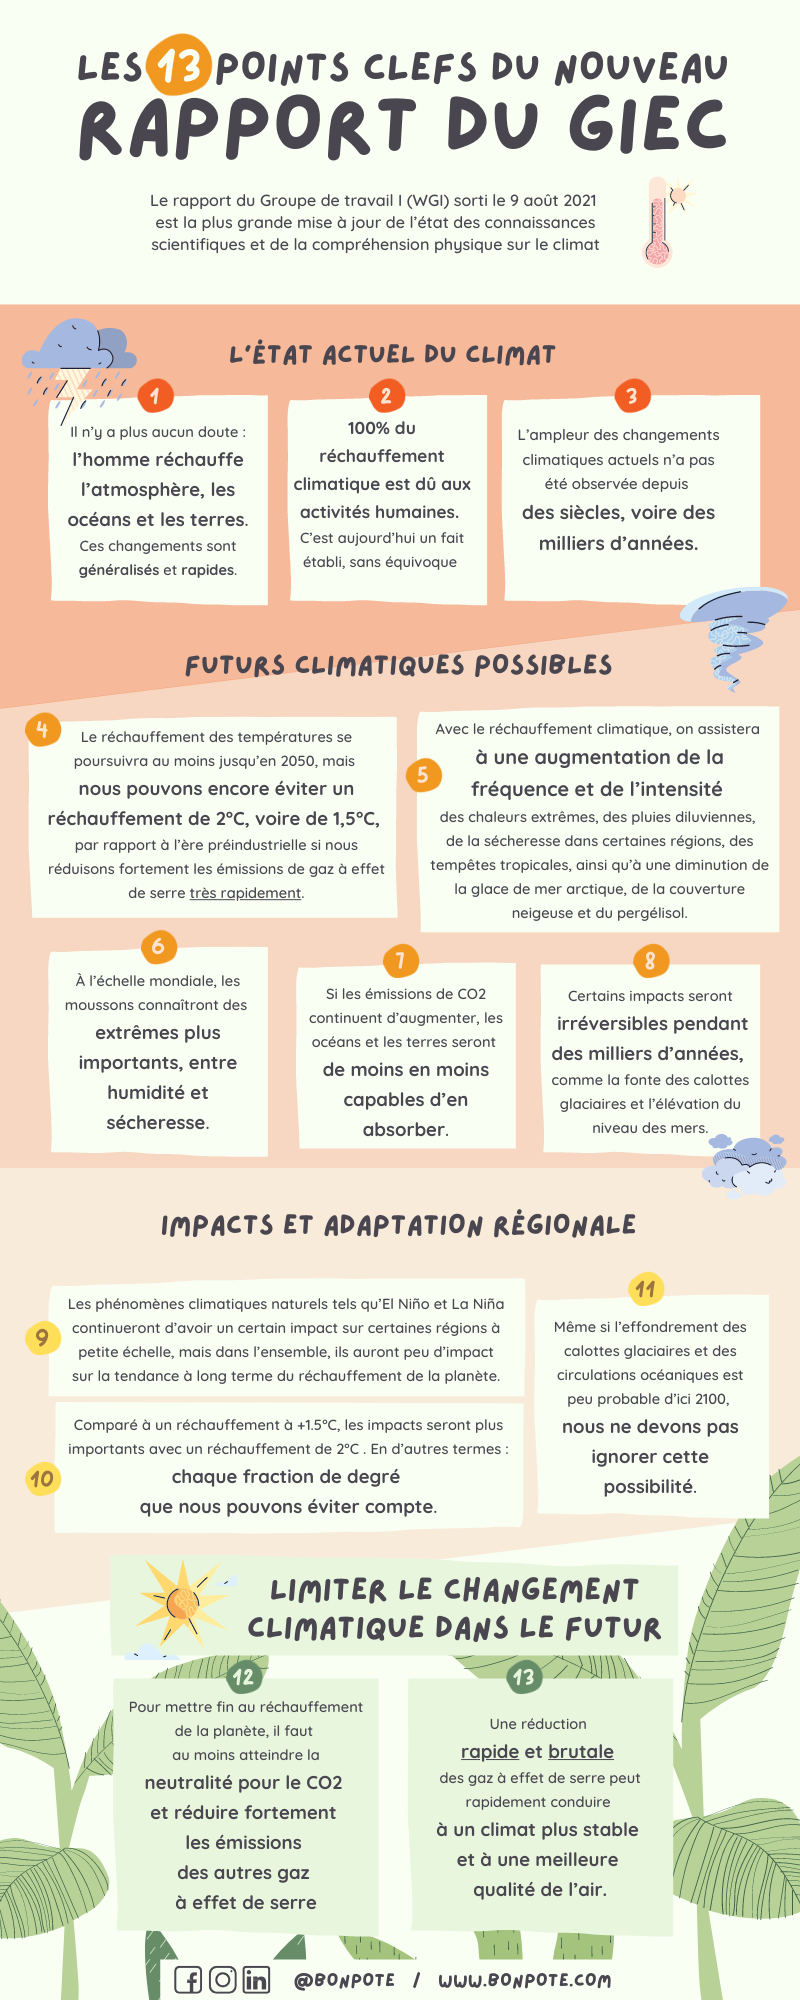
Here are the key takeaways that the IPCC has put forward in its Summary fo Policymakers:
The current state of the climate
A.1 There is no longer any doubt: Humans are warming the atmosphere, the oceans and the land. These changes are widespread and quick.
A.2 The magnitude of the current climate changes has not been observed for centuries, if not for thousands of years.
A.3 The evidence for human (or anthropogenic) responsibility for heat waves, torrential rains, droughts and tropical storms is far stronger.
Possible climate futures
B.1 Temperatures will continue to rise until at least 2050, but a warming of 2°C or even 1.5°C compared to pre-industrial era levels can still be avoided if we reduce greenhouse gas emissions sharply and vigorously.
B.2 As the planet becomes warmer, there will be an increase in the frequency and intensity of extreme heat episodes on land and in the oceans; heavy rainfall; drought in some regions; tropical storms, and a decrease in Arctic sea ice, snow cover and permafrost.
B.3 Globally, monsoons will go to greater extremes between humidity and drought.
B.4 If CO2 emissions continue to rise, the oceans and the land will be less and less able to absorb it.
B.5 Some impacts will be irreversible for thousands of years, such as melting ice caps and rising sea levels.
Climate information for regional risk assessment and adaptation
C.1 Natural climate events such as El Niño and La Niña will continue to have some small-scale impact on some regions, but overall will have little impact on the long-term trend of global warming.
C.2 Theimpacts will be greater with a warming of 2°C , than with a warming of +1.5°C. In other words, every avoidable fraction of a degree matters.
C.3 Even if the collapse of the ice caps and ocean circulations is unlikely to occur by 2100, the possibility of this happening should not be ignored.
Limiting future climate change
D.1 To stop global warming, we must at least achieve CO2 neutrality and significantly reduce emissions of other greenhouse gases.
D.2 A rapid and abrupt reduction in greenhouse gases can quickly lead to a more stable climate, as well as to improved air quality.

Analyzing climate change and its possible evolutions and consequences
The new IPCC report includes great infographics, especially the ones featured in the summary for policy makers. These maps/infographics help visualize how the climate has evolved and how it may change as a result of our emissions. Here are some of them (non exhaustive list).
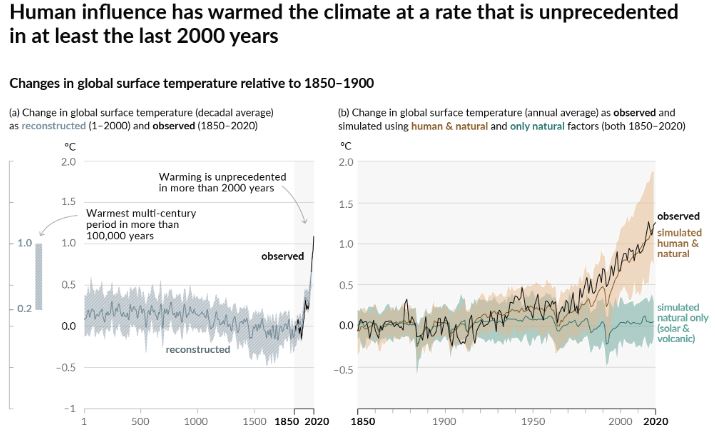
One quick look at the SPM.1 Figure shows that the rate of global warming is ‘unprecedented’. The graph on the right (which is a close-up of the figure on the left, from 1850 to the present), allows to visualize what happens when one changes scales. We can clearly see that we have reached about 1.1 to 1.2°C of warming compared to pre-industrial levels, which cannot be explained by natural causes alone (in blue).
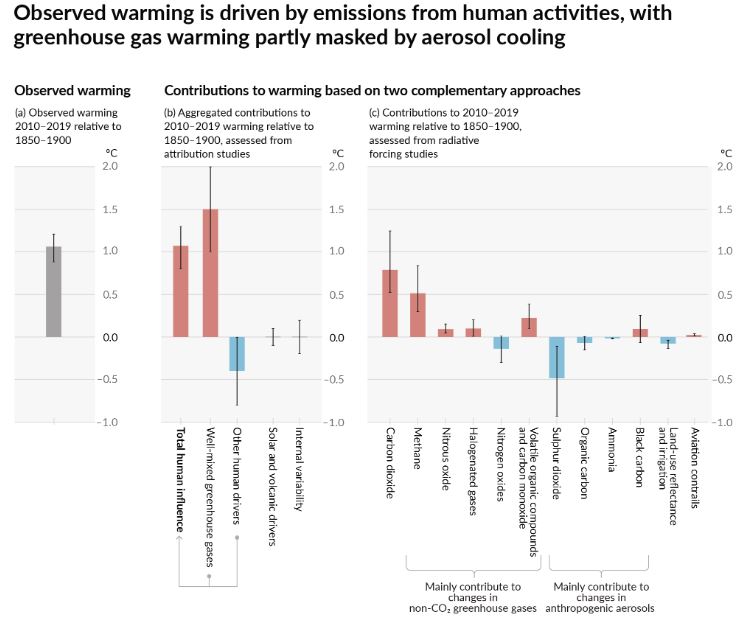
FIGURE SPM.2 : Understanding radiative forcing is very important when trying to figure out what is causing global warming, and how science accounts for it. This is a 101 and I highly recommend that you dedicate a few minutes of your time to it.
Here we see the error bars (margins) in action. This shows that scientists take uncertainty into account, which is a key element when one ventures to read an IPCC report (and/or any scientific report). What does this mean?
An exceptionally unlikely scenario where all human influences would be at the bottom of their error bars and all natural influences would be at the top of theirswould not be enough to explain global warming. This is why scientists can afford to say “unequivocal“.
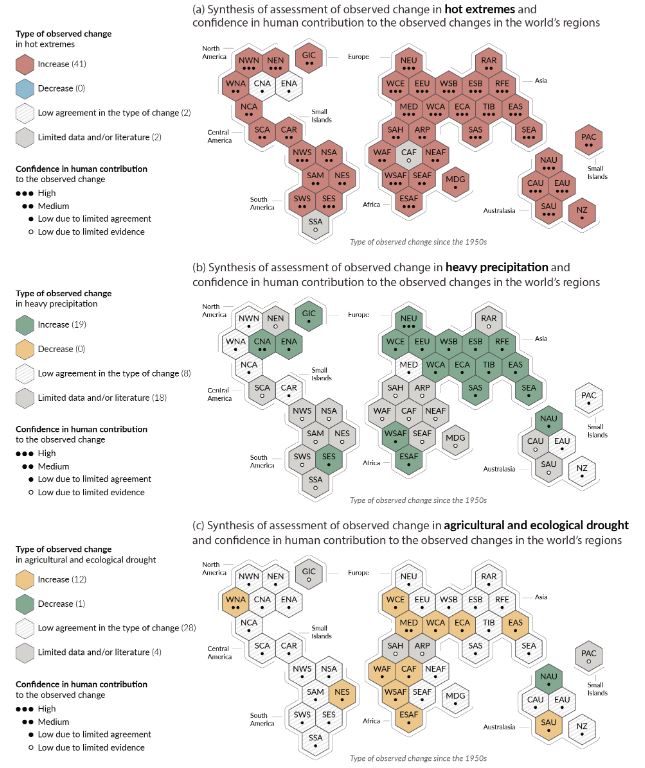
SPM.3 Figure: Here is an infographic that shows how likely a region is to be affectedby a given extreme meteorological event
The IPCC also points out that “natural factors and internal variability will modulate human-induced changes, especially on regional and short-term scales, with little effect on centennial climate warming.” It is crucial to factor in these modulations when planning for all possible changes, including risk management.
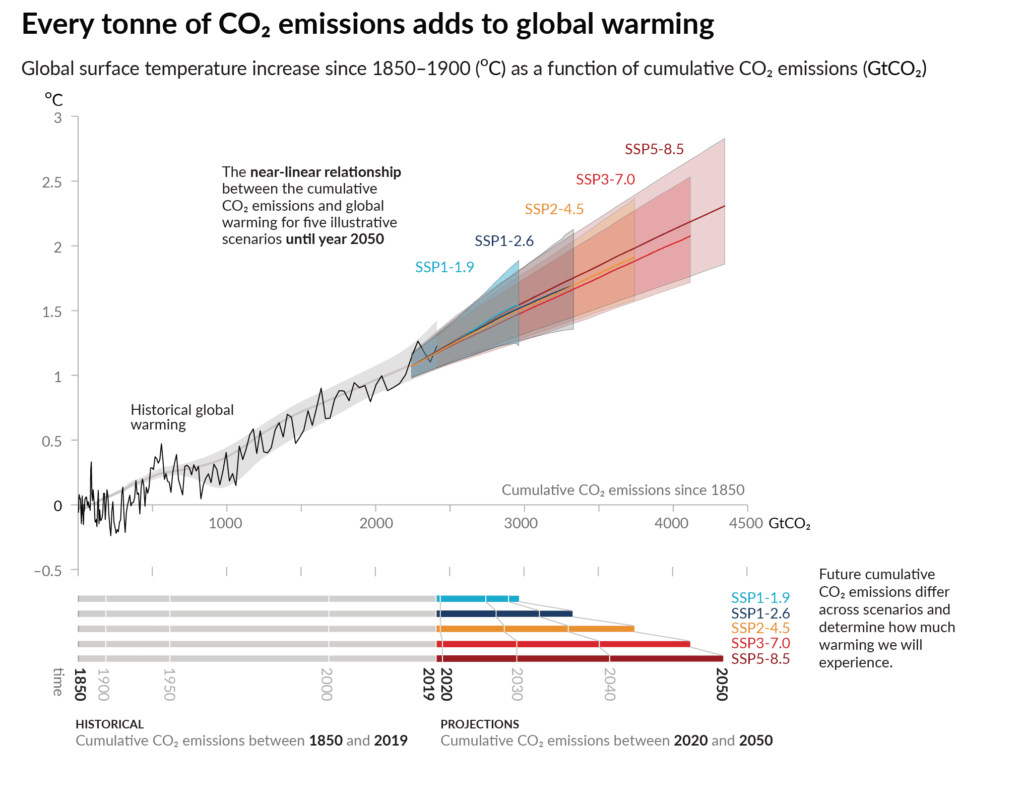
SPM.10 Figure: This figure illustrates the most important dimension of the report: each ton emitted contributes to global warming. This concretely means ourclimate future is in our hands, and that if we emit fewer greenhouse gases, consequences will be less irreversible and catastrophic.
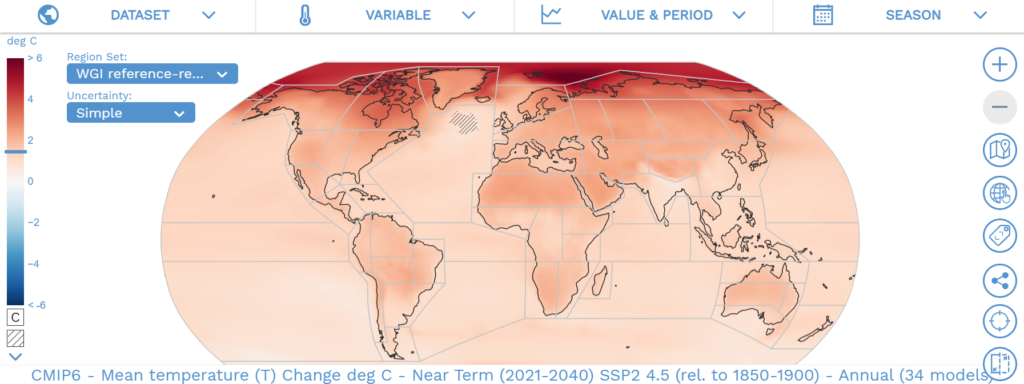
Interactive atlas
The IPCC has made available an extremely useful interactive atlas, which allows one to see the effects of global warming on the different regions of the world, with a warming of +1.5°C, +2°C, +3°C, etc… It is very easy to use and can speak to everyone, even to the youngest.
BONUS: INFOGRAPHICS
The content of the infographics below is the same. It comes in several formats and colors on purpose, so that everyone can save/print what they prefer:
Translations in several languages are available here, and will soon be available in PDF format for printing!
A final word
While the summary was perhaps a little long, and might have included some difficult terms at first, I hope that it will allow you — as a parent, teacher or professor — to explore the subject with each and everyone.
We cannot afford to waste any more time: Every ton counts. Let’s train, let’s help others train, and let’s take action. If you want to know more, here goes:
- Dozens (if not hundreds) of hours of videos/articles/podcaststo explore all things climate and environment-related
- Dozens of books
- Learn more about all climate-related topics (and learn how to challenge preconceived/climatoskeptical ideas) with our series of articles written in partnership with the CNRS.
- Take action with this list of 10 actions