After the report of the Working Group I (WGI) and II (WGII), released in February 2022, the 3rd and last report is finally out!
After presenting the physical understanding of climate change, its impacts and necessary adaptation, this report provides a global and updated assessment of advancements and commitments on climate change mitigation. It explains the evolution of emission reduction and mitigation efforts, assessing the impact of national climate commitments against long-term emission targets.
This 3rd report takes stock of past and present emissions, provides an outlook for future emissions and options for reducing emissions by major sectors or systems (energy, transport, buildings, industry, agriculture, land use and food, cities, etc.). Note that there are some important new features in the full report, including an entire chapter on the social aspects of mitigation, which explores the aspect of the “demand”, i.e., what drives greenhouse gas consumption and emissions.
Reducing energy consumption, meat consumption, or even the use of private cars? A premiere that politicians would do well to learn from…
Sommaire
Foreword
Before reading on, it is essential that you know what the IPCC is, how the authors who write the report are selected, what the selection process is for scientific articles, who finances it, etc. If you know this, great, if not, read this article. In addition, I strongly encourage you to read the summary of the first report and the second report, a real plus before embarking on this third part.
Things to remember anyway about the 3rd report:
- This report is the synthesis of about 18 000 scientific papers. The 278 lead authors responded to 59,212 comments from governments and experts (!!!!). The Summary for Policymakers was validated line by line by governments, after two weeks of deliberation on each sentence.
- There are 3 versions:
- the Summary for Policymakers (SPM, 64 pages, 50% longer than other summaries for policymakers)
- the technical summary (TS, 145 pages)
- the full report (FR, 2913 pages).
Tip: Read the Summary for Policymakers, several times if necessary, and read the technical summary if possible.The full report should be more of an encyclopedia: you want to further investigate a point? ->dive into the full report. And you are free to read the whole report of course…
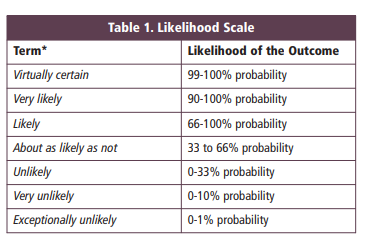
- The IPCC has a list of qualifiers used, depending on the level of confidence (indicated in italics in the reports, same ones as the previous report):
- virtually certain (99 to 100% probability)
- very likely (90 to 100%)
- likely (66-100%)
- about as likely as not (33% to 66%)
- unlikely (0-33%)
- very unlikely (0-10%)
- exceptionally unlikely (0 to 1%).
Finally, one must realize the sacrifices involved in writing an IPCC report. The scientists work on a voluntary basis, very often working during their personal time, and have spent several evenings and sleepless nights so that this report can be as qualitative as possible and accessible to everyone, particularly through the SPM and the technical summary.
Two weeks of extremely intense negotiations, with up to 400 delegates and authors from all over the world participating in meetings, working groups… with the finalization of the Summary for Policymakers being 48 hours late. This was the longest IPCC approval plenary session in its 34-year history. It is not very surprising: everyone agrees on anthropogenic climate change, but the solutions are a little more discussed…
The key points of the new IPCC report
Before diving into some of the details, here are the main conclusions of the new IPCC report (Summary for Policymakers + some elements of the Technical Summary).
Recent developments and current trends.
Record emissions for the last decade
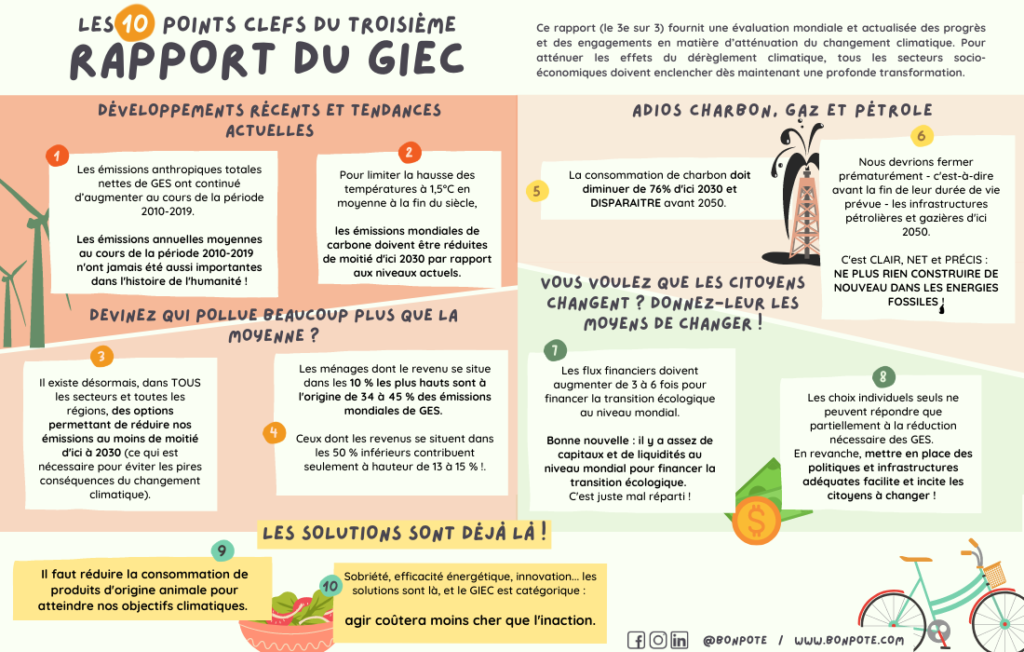
- B.1: Total net anthropogenic GHG emissions have continued to increase during the 2010-2019 period, as have cumulative net emissions since 1850. Average annual emissions during 2010-2019 were higher than in any previous decade, but the rate of growth between 2010 and 2019 was lower than between 2000 and 2009.
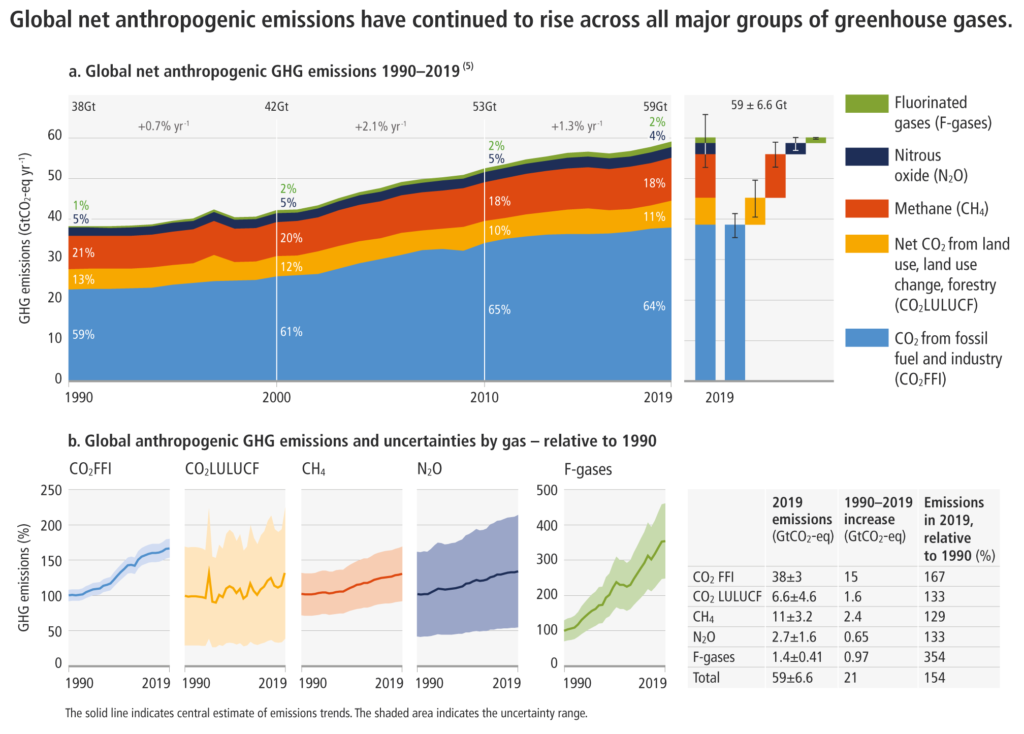
- B2: Net anthropogenic GHG emissions have increased since 2010 across all major sectors globally. An increasing share of emissions can be attributed to urban areas.
- Reductions in CO2 emissions from fossil fuels and industrial processes (…), have been less than the emissions increases from to rising global activity levels in industry, energy supply, transport, agriculture, and buildings. (high confidence)
- B3: Regional contributions to global GHG emissions continue to differ widely. Variations in regional, and national per capita emissions partly reflect different stages of development, but they also vary widely at similar income levels. The 10% of households with the highest per capita emissions contribute disproportionately to global household GHG emissions..
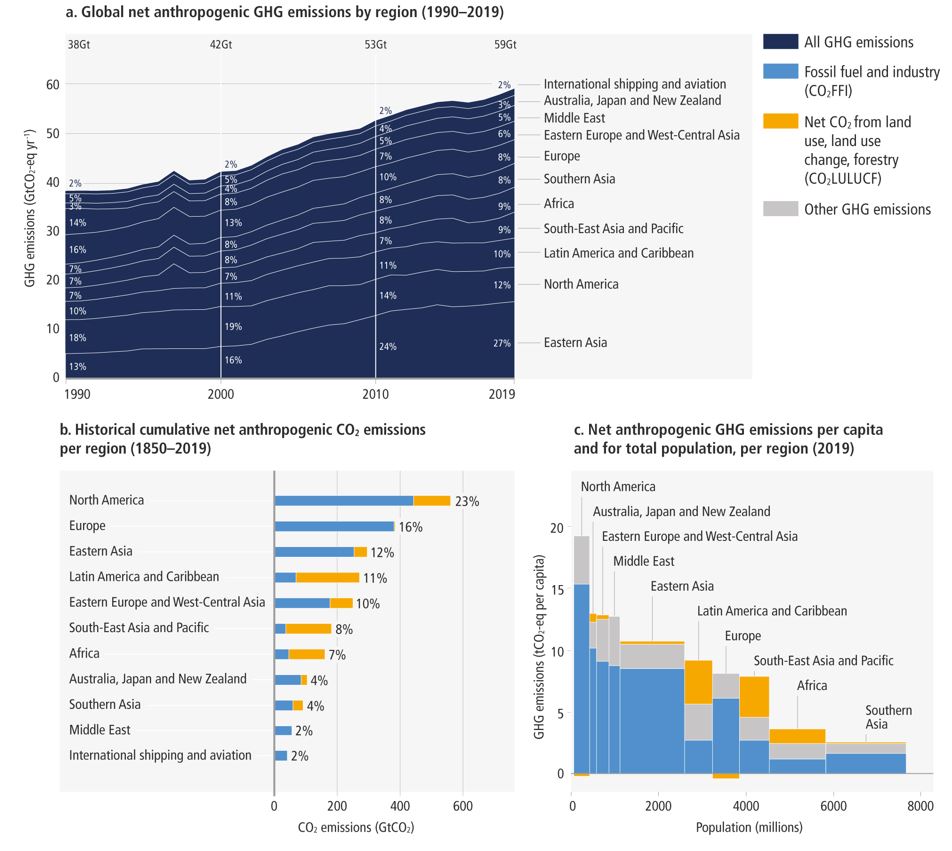
from 1850 to 2019
Emissions have increased in most regions of the world but heterogeneously, both today and cumulatively since 1850.
Innovation policies
- B4: Unit costs of several low-emission technologies have fallen continuously since 2010. Appropriate and global policies addressing innovation systems have helped overcome the distributional, environmental, and social effects potentially associated with globalization (high confidence)
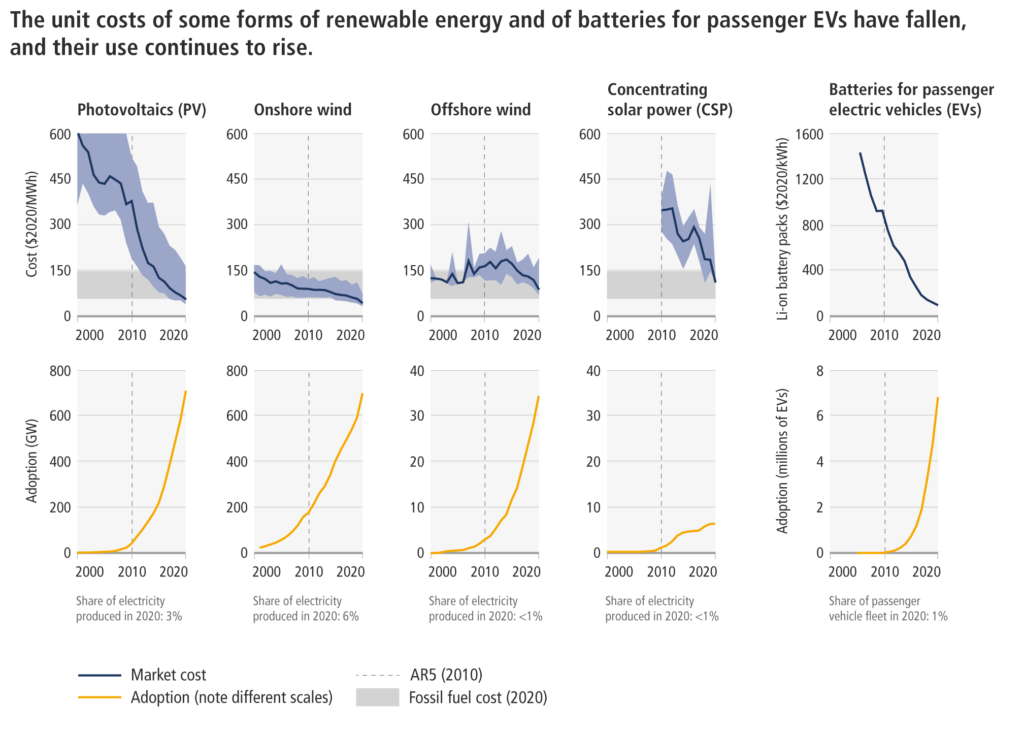
- B5: Since the last report, there has been a steady increase in mitigation policies and legislation. This has prevented emissions that would have otherwise occurred and increased investment in low-carbon technologies and infrastructure. You read that right: it could have been worse…
Respecting the Paris Agreement
- B6: Global GHG emissions in 2030 combined with the implementation of nationally determined contributions (NDCs) announced prior to COP26 will make it likely that warming will exceed 1.5°C during the 21st century and make more difficult to limit to +2°C after 2030.
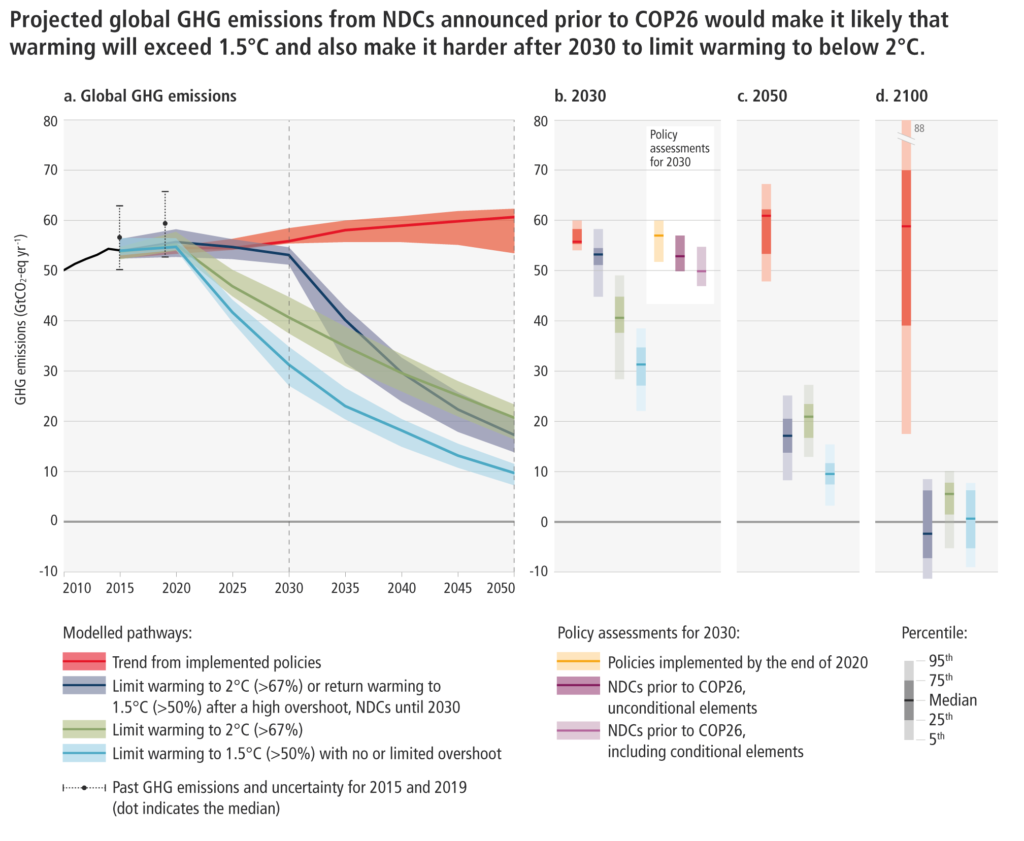
and projected emissions results from short-term policy assessments for 2030 (panel b).
- B7: Projected cumulative future CO2 emissions over the lifetime of existing and currently planned fossil fuel infrastructure, without additional reductions, exceed total cumulative net CO2 emissions in pathways that limit warming to 1.5°C (>50%), with no or limited overshoot. This is an extremely important point: without early closure of some coal, gas and oil operations, we will exceed +1.5°C warming.
Systemic transformations to limit global warming
The next few years will be critical to improve the chances of success.
- C1: Global GHG emissions are projected to peak between 2020 and no later than before 2025 in the globally modeled scenarios that limit warming to 1.5°C (>50%) with no or limited overshoot, and in those that project limiting warming to +2°C (>67%) and assume immediate action. More details are available in the SPM and the full report
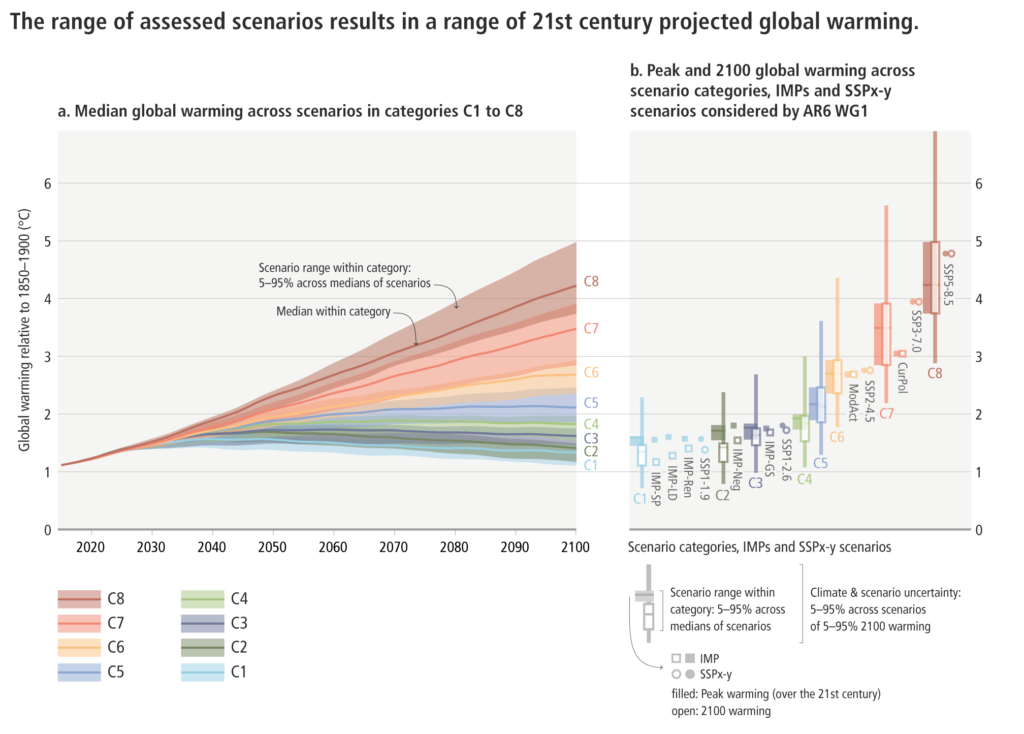
In the above scenarios we find the5 different socio-economic pathways (SSP) and the Illustrative Mitigation Pathways (IMP). An article will follow on Bon Pote to understand how they work. In the meantime, you can already read this article.
Bonus: you can also dive into the scenarios of the 3rd report with this link that gives access to the databases.
Carbon neutrality in the industry and cities
- C3: All global modeled pathways that limit warming to 1.5°C (>50%) with no or limited overshoot, and those that limit warming to 2°C (>67%) involve rapid, deep and, in most cases, immediate reductions in GHG emissions across all sectors. This is extremely important to remember when a sector or company announces carbon neutrality in 2050, without a short-term action plan.
- C4: Reducing GHG emissions across the full energy sector requires major transitions, including substantial reductions in overall fossil fuel use, deployment of low-carbon energy sources. Using existing facilities without reduction will make it impossible to meet the climate commitments (high confidence).
- C5: Net-zero CO2 emissions from the industrial sector are challenging but possible. Reducing industry emissions will entail coordinated action throughout value chains to promote all mitigation options, including demand management, energy and materials efficiency, circular material flows, as well as abatement technologies and transformational changes in production processes.
- C6: Urban areas can significantly reduce GHG emissions through systemic transition of infrastructure and urban form to low-emission development pathways.
Reducing demand: sufficiency
- C8: Demand-side options and low-carbon technologies can reduce transport sector emissions in developed countries and limit emissions growth in developing countries (high confidence).
- Electric vehicles powered by low-emission electricity offer the largest decarbonisation potential for ground transportation on a life cycle basis (high confidence).
- Many mitigation strategies in the transport sector would have various co-benefits, including air quality improvements, health benefits, equitable access to transportation services, reduced congestion, and reduced material demand (high confidence).
Greenhouse gas emissions from the agriculture, forestry, and other land use (AFOLU) sector.
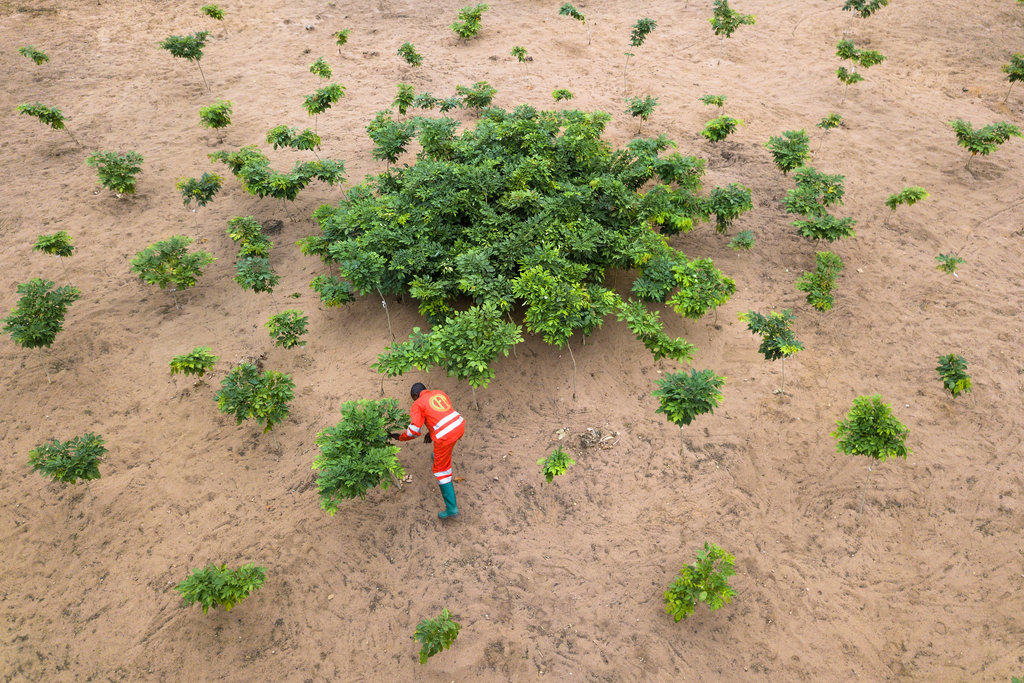
- C9 : When implemented in a sustainable manner, mitigation options from the agriculture, forestry, and other land uses (AFOLU) sector can achieve large-scale GHG emission reductions and enhanced removals, but cannot fully compensate for delayed actions in other sectors.
- There are many country-specific opportunities to provide co-benefits (such as biodiversity conservation, ecosystem services, and livelihoods) and avoid risks (e.g., through climate change adaptation). (high confidence)
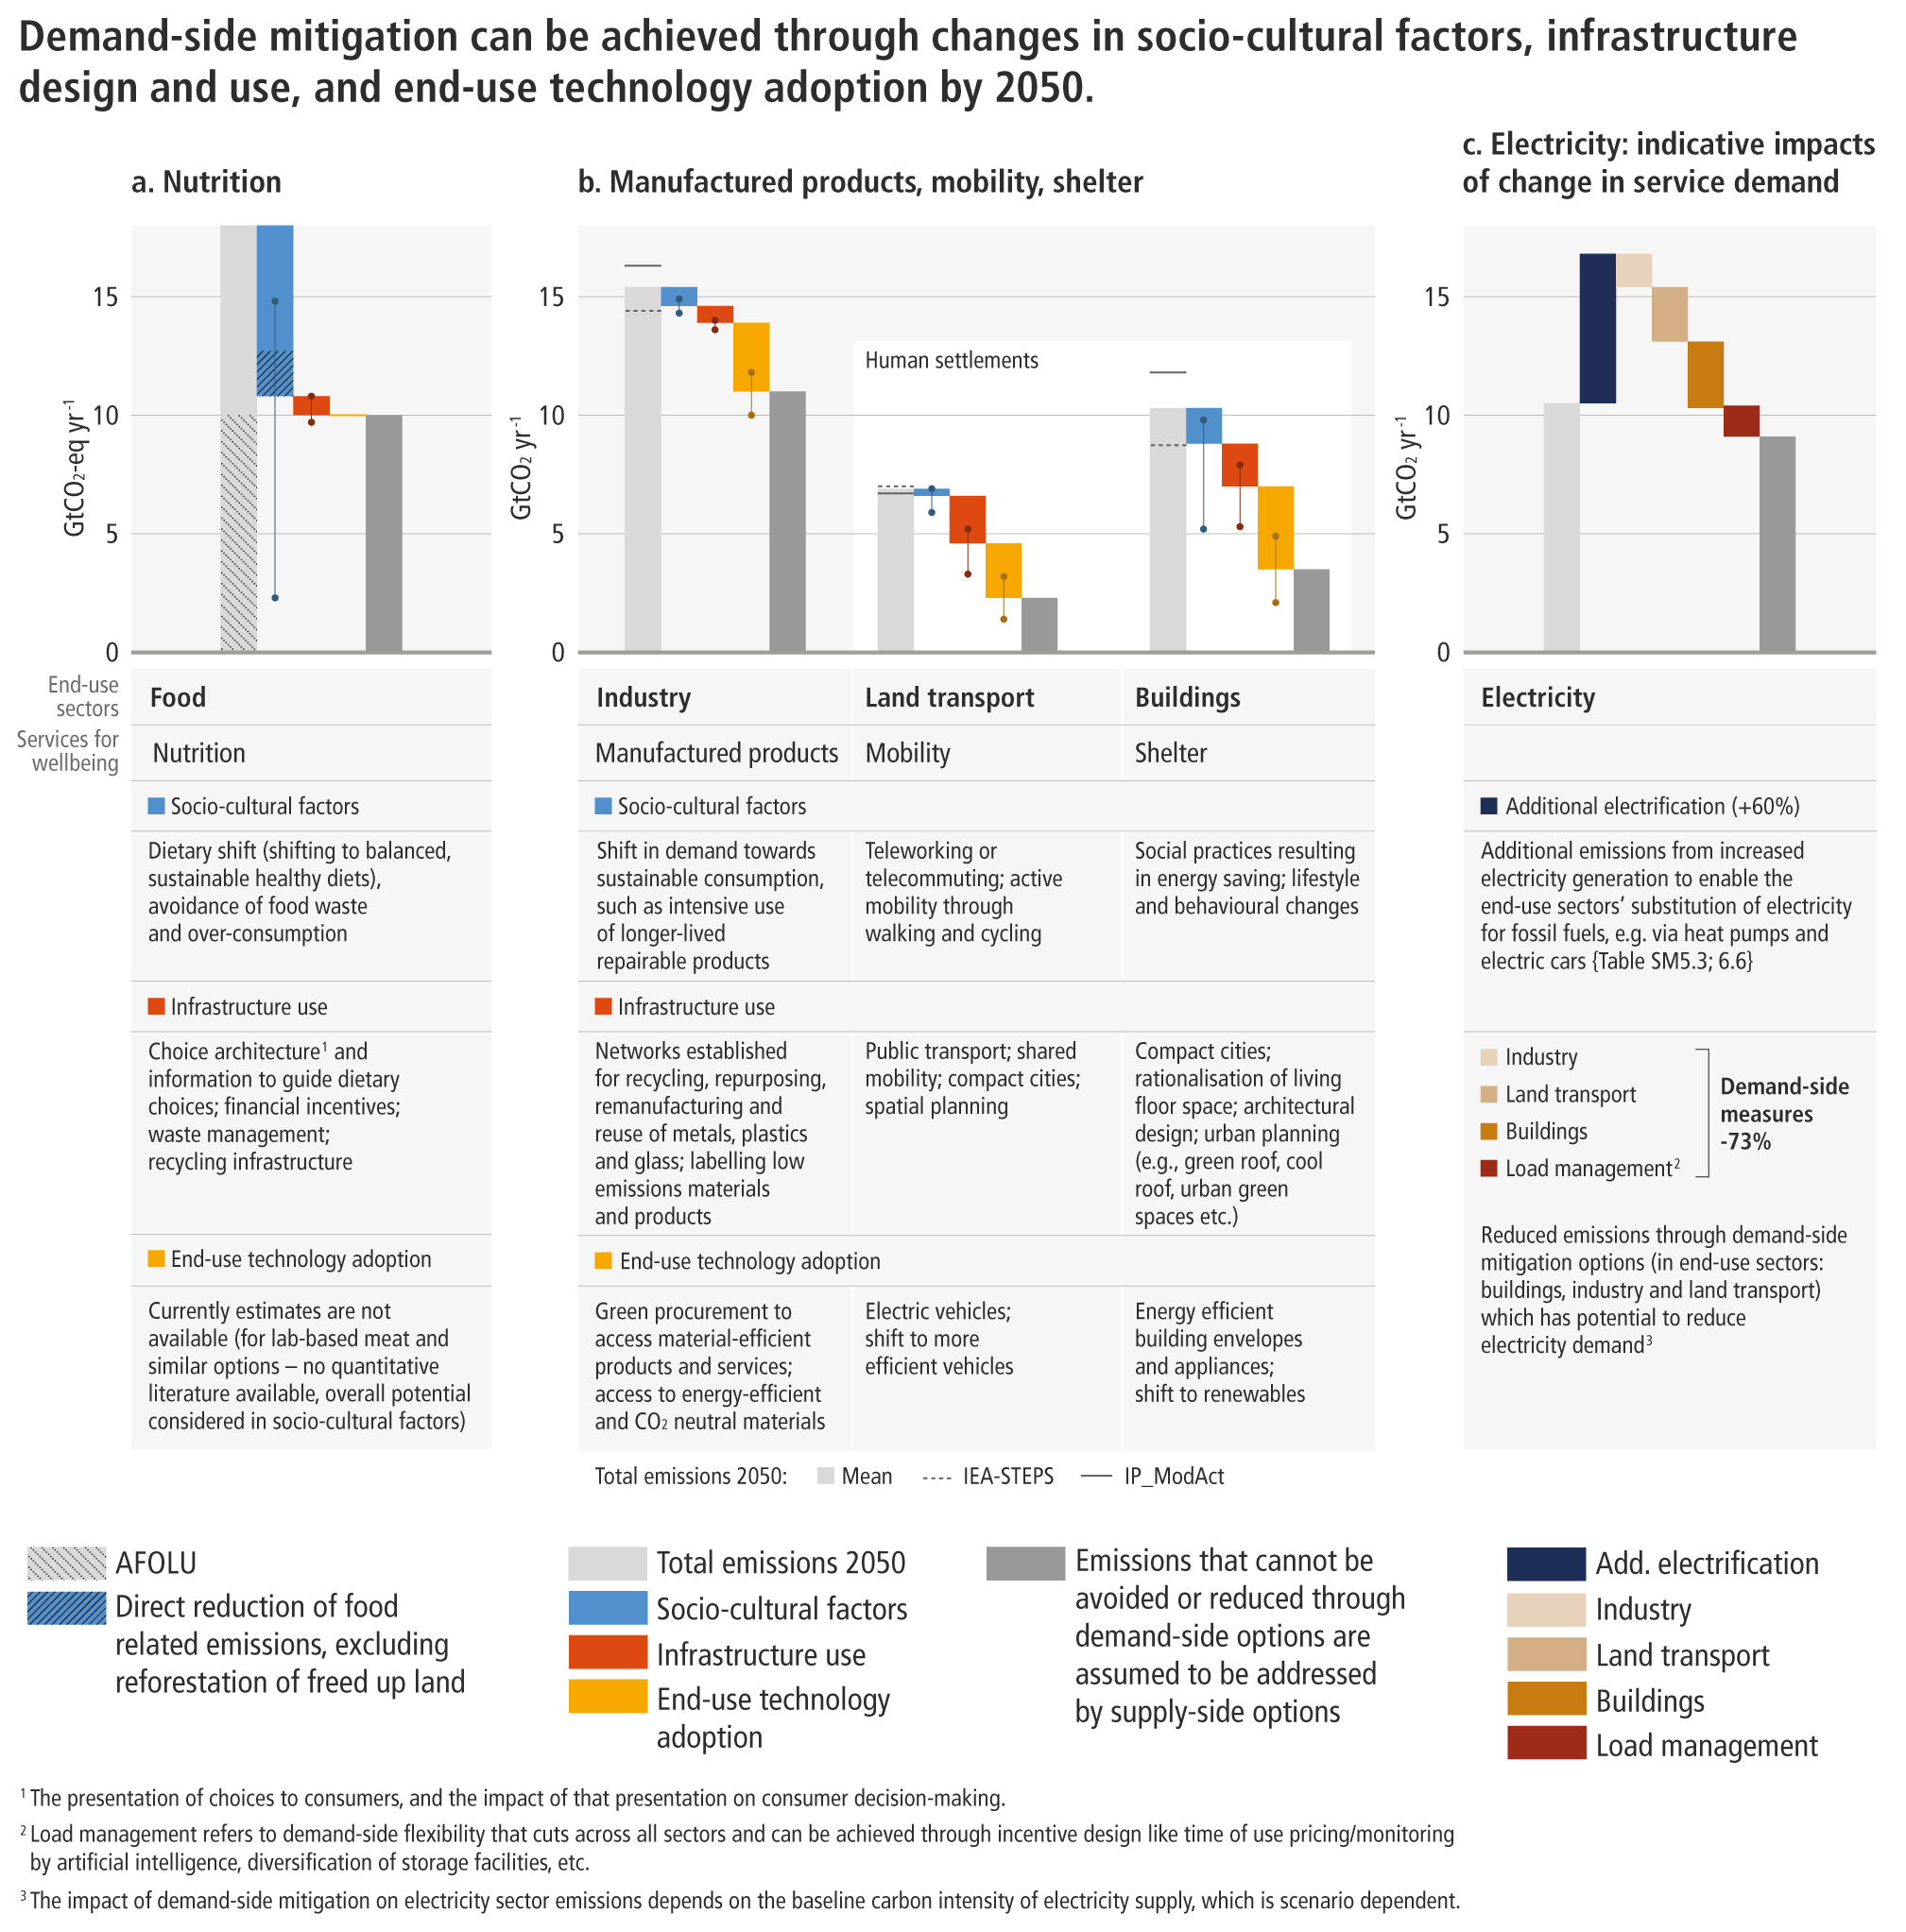
- C10: Demand-side mitigation encompasses changes in infrastructure use, adoption of end-use technologies, and socio-cultural and behavioral change.. Demand-side measures taken or to be taken can reduce global GHG emissions in the end-use sectors by 40-70% by 2050 compared to baseline scenarios (high confidence).
Negative emissions and financing
- C.11: Deployment of carbon dioxide removal (CDR) to counterbalance hard-to-abate residual emissions is unavoidable if carbon neutrality (CO2 or any GHG) is to be achieved. The scale and timing of deployment will depend on the gross emissions reduction trajectories in different sectors.
Linkages between mitigation, adaptation and sustainable development
Clear benefits of reducing our emissions
- D1: Accelerated and equitable climate action in mitigating, and adapting to, climate change impacts is critical to sustainable development.. Climate change actions can also result in some trade-offs. The trade-offs of individual options could be managed through policy design. The Sustainable Development Goals (SDGs) (…) can be used as a basis for evaluating climate action in the context of sustainable development:
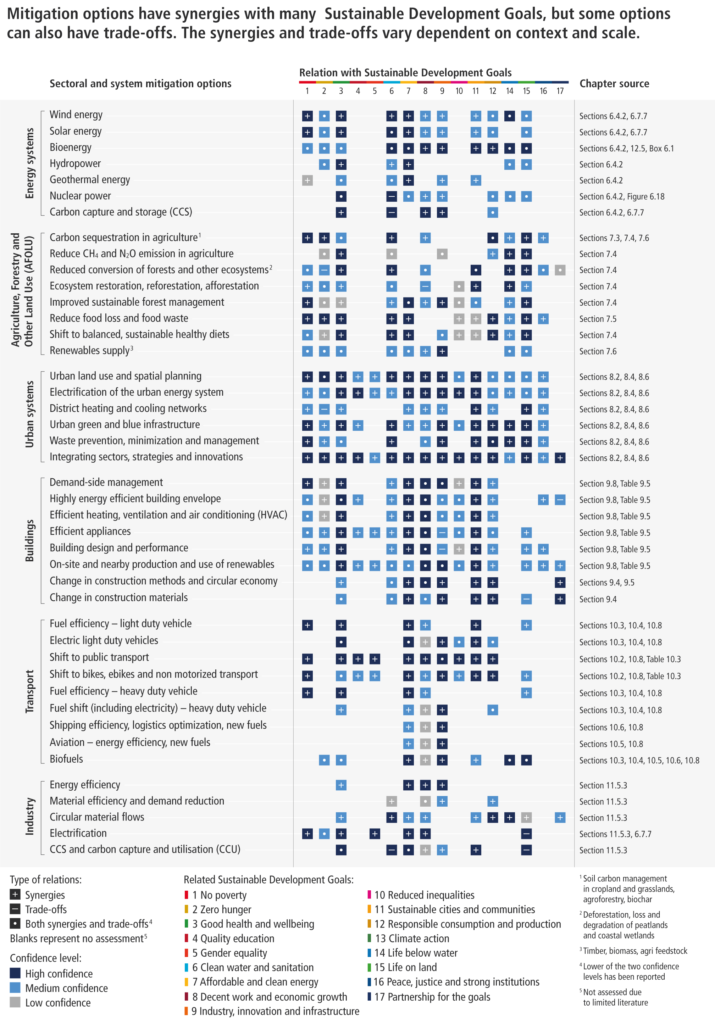
Figure SPM.8 Synergies and tradeoffs between sectoral and systemic mitigation options and the SDGs
- D3: Enhanced mitigation and broader action to shift development pathways towards sustainability will have distributional consequences within and between countries. Attention to equity and broad and meaningful participation of all relevant actors in decision-making at all scales can build social trust, and deepen and widen support for transformative changes.
Strengthen the response
- E1: There are mitigation options that can be deployed on a large scale in the short term. Feasibility varies by sector and region, and by capacity, speed and scale of implementation. Barriers to feasibility should be reduced or removed, and enabling conditions strengthened to deploy mitigation options at scale.
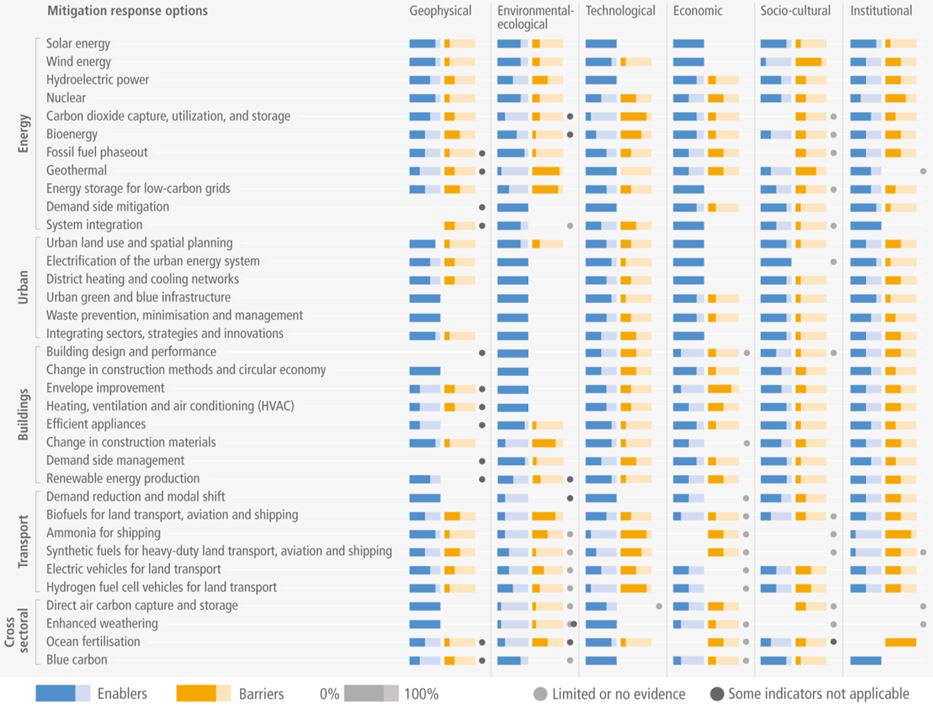
sociocultural, and institutional factors can enable or impede the deployment of response options.
- E3: Climate governance is most effective when it integrates across multiple policy domains, helps realise synergies and minimize trade-offs, and connects national and sub-national policy-making levels (high confidence)
- E5:Tracked financial flows fall short of the levels needed to achieve mitigation goals across all sectors and regions. . The challenge of closing gaps is largest in developing countries as a whole.
- E6: International cooperation is a critical enabler for achieving ambitious climate change mitigation goals. . The UNFCCC, Kyoto Protocol, and Paris Agreement are supporting rising levels of national ambition and encouraging development and implementation of climate policies, although gaps remain.

Detailed analysis of some points of the new report
It always takes time to digest this sort of report and it would be worth writing more articles in the months to come as its density is so impressive. One quickly realizes the complexity of the effects of climate change on our societies when one delves deeper into the technical summary, and into the report itself. Although it is always difficult to make a selection, here are a few things to remember.
WARNING: How not to misinterpret the emissions scenarios in the IPCC report
It is important to understand that the scenarios presented in this third part of the IPCC report are neither predictions nor forecasts for the future. They are possible paths, depending on the assumptions made and put into a model that has its own advantages and disadvantages.
Also, and this is important to remember, the IPCC does not recommend ANYTHING. It does not take a position neither pro RE, nor pro nuclear, nor green growth, nor degrowth.. It summarizes the scientific literature on the subject. If out of 10 scenarios, 9 indicate nuclear fusion operational in 2030 everywhere in the world and 1 scenario indicates that it is not, this does not mean that there is 90% of chances that it will happen.
Joeri Rogelj, lead author of IPCC Group 1, summarized in 5 points the errors to avoid:
- Do not interpret the set of scenarios as a statistical sample or in terms of likelihood/agreement in the literature;
- Do not focus only on the medians, but consider the full range of the scenario set;
- Do not select individual scenarios to draw general conclusions (so no cherry-picking!);
- Do not over-interpret the results of the scenarios and do not venture too far from the original research objective;
- Do not conclude that the absence of a particular scenario means that this scenario is not possible.
Is the decrease in demand (sufficiency) compatible with an increase in well-being?
Despite the generally preconceived ideas, the IPCC provides some clarifications on the issue of well-being and sufficiency. Thus, it is written in the FAQ’s:
There is a growing realisation that mere monetary value of income growth is insufficient to measure national welfare and individual well-being. Hence, any action towards climate change mitigation is best evaluated against a set of indicators that represent a broader variety of needs to define individual well being, macroeconomic stability, and planetary health. Many solutions that reduce primary material and fossil energy demand, and thus reduce GHG emissions, provide better services to help achieve well being for all..
No, we don’t have X years left before the tragedy
The IPCC has never said that we have X years left before “the end of the world”, “collapse” or any other superlative to characterize global warming and its consequences. The climate does not work like that. Everything will not be OK on December 31, 2029 at 11:59 pm, and then the next minute the world will fall apart.
The scientific literature gives some clues about the dangers of announcing a deadline, including some rhetoric that would force the IPCC to take responsibility for a specific date. What would happen if a date was given and it did not happen exactly as stated? The whole credibility of the IPCC would collapse.
Generally speaking, it is the NGOs and climate activists who use this wording, wanting to do the right thing and emphasize the urgency. But it has already happened that the press has published headlines with deadlines and since the “collapse” of this or that has not happened, the climate skeptics have jumped on the opportunity to mock the climate movement.
The logic is and will always be the same: every day counts, every day of inaction has consequences and reduces the room for maneuver to meet our climate commitments.
What does +3.2°C mean?
This refers to point C.1 in the Summary for Policymakers, which states that “without strengthening nationally determined contributions beyond those implemented by the end of 2020, GHG emissions are projected to increase beyond 2025, leading to a median global warming of +3.2°C by 2100” (medium confidence).
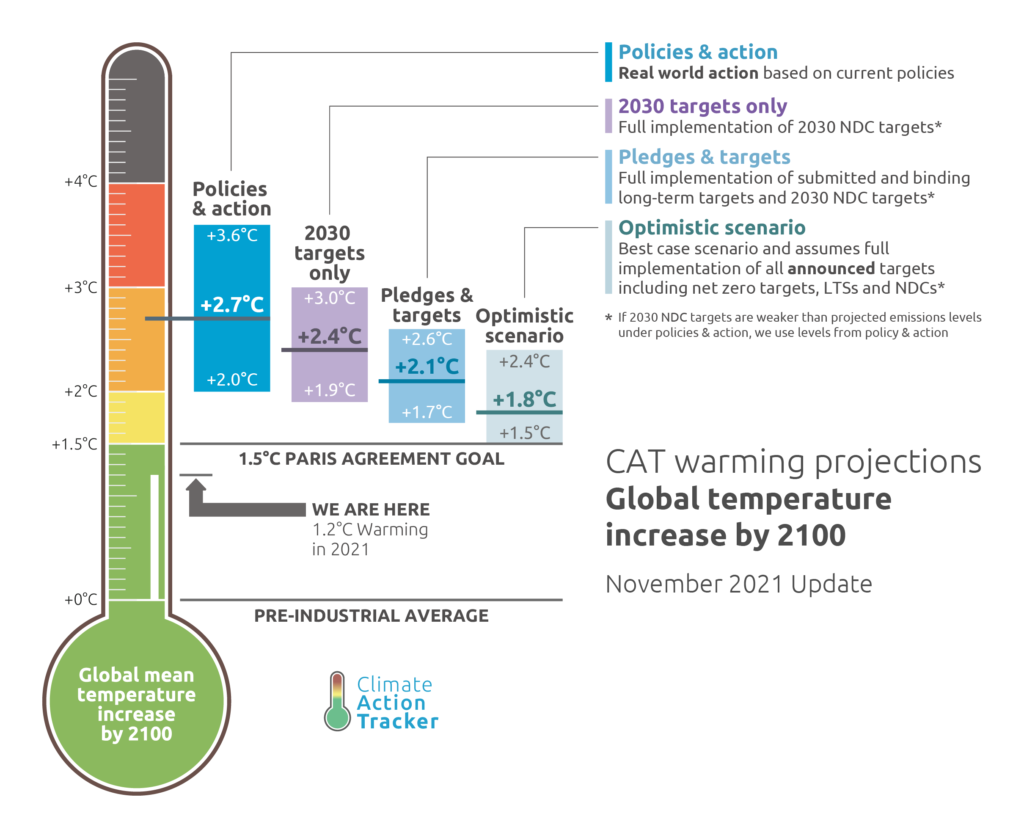
Since the IPCC work only took place BEFORE COP26, we can consider that the commitments made at COP26 reduce this temperature increase. After COP26, according to the new NDCs, we would be, according to Climate Action Tracker,
- towards a trajectory of +2.4°C (range +1.9°C to +3.0°C) if the 2030 commitments are respected;
- towards a trajectory of 1.8°C (1.5°C to 2.6°C) if the long-term carbon neutrality commitments are met.
Useful reminder: promises only engage the ones who believe in them.
What about nuclear power?
Nuclear power tends to monopolize 90% of energy debates in France, even though it is far from being the majority of our energy mix (fossil fuels dominate by far).
In the Summary for Policymakers, the word “nuclear” appears only twice, once to mean that there is a significant investment cost to benefit from it (point C.3.6).
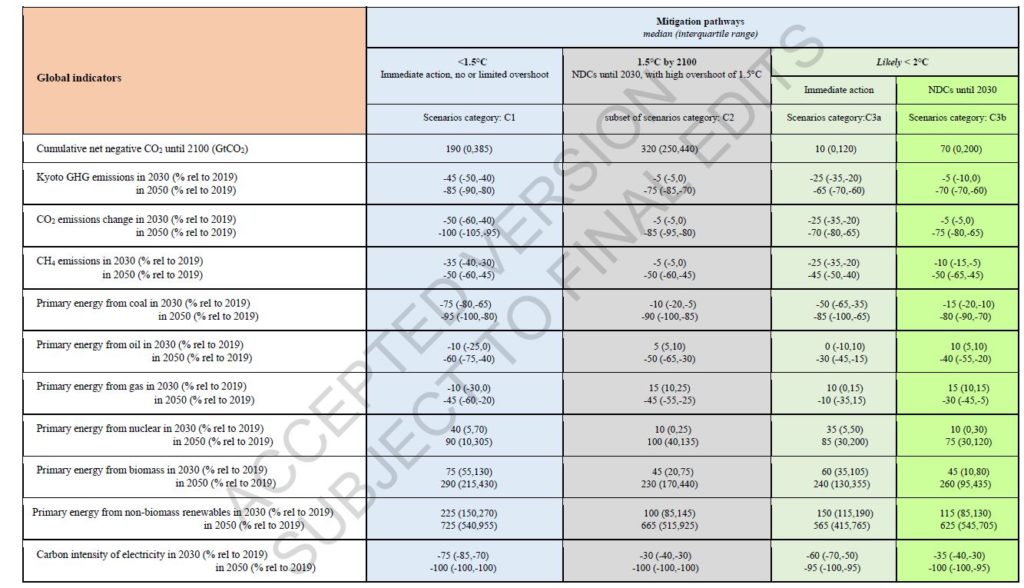
In the technical summary, it appears 8 times, and in particular in table TS.2, which is a comparison of the main characteristics of the mitigation scenarios providing for immediate action to limit warming to +1.5°C / +2°C compared to the current scenarios following the NDCs until 2030:
It will probably be necessary to carry out a similar work as the one done in the Special Report 1.5 for nuclear power. However, for the specific case of France, the work done by RTE is preferable.
The final word
This new report from IPCC Working Group 3 confirms that we have the solutions, that they are accessible and that all that is missing is the political will to implement them.
Once again, this is the first time in history that a scientific report has and will have such importance, on scientific, political, geopolitical and economic levels. . Its conclusions will be decisive for the upcoming negotiations at COP27.
Really, at least read the Summary for Policymakers. Very strong language was used, such as the premature closure of some fossil fuel infrastructures. Everyone needs to take hold of this report and not let any politician or business leader continue with business as usual: we no longer have time.
BONUS : DOWNLOAD THE SLIDES HERE