
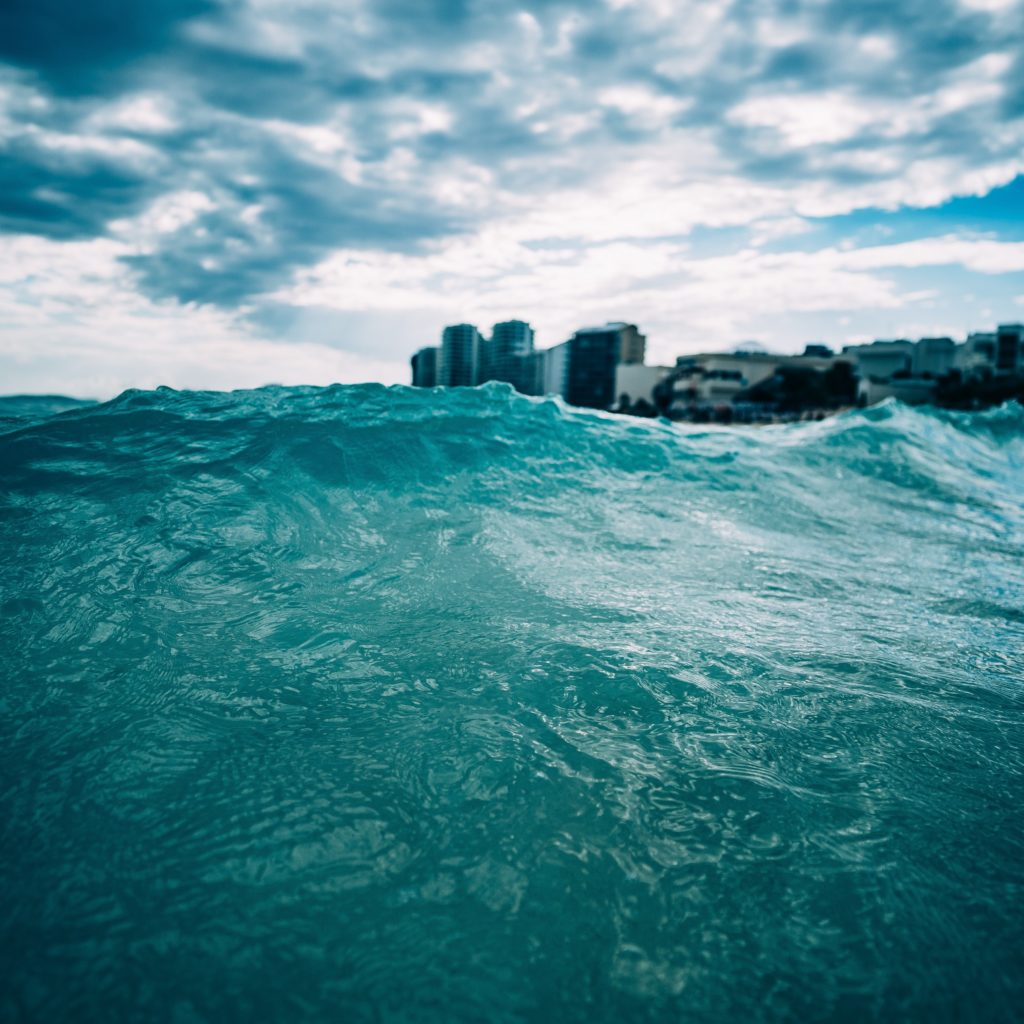
Today, about half of the world’s population live within 200 kilometers of a coastline, and an estimated one out of ten people live less than 10 m above current sea levels.
For the world’s inhabitants, sea level rise will be one of the worst consequences of climate change. But why are these two phenomenons related ? Haven’t global sea levels always changed throughout the course of Earth’s history ?
We’d like to offer our help to fellow climate deniers by clearing things up on this topic. For that, we have received the help of Anny Cazenave, researcher at the Laboratory of Space Geophysical and Oceanographic Studies (LEGOS), member of the Academy of Sciences, and one of the main authors of the “Sea level change” chapter of the fifth Assessment feport of the Intergovernmental Panel on Climate Change (IPCC).
Sommaire
Why is the sea level changing ?
On a time scale of several decades, sea level changes for two reasons:
- Fluctuations in the ocean’s temperature.
Cold and salty water is very dense, and takes up less space than warm water. As the ocean gets warmer, the water expands, thereby increasing the volume of water and causing sea level rise. This is called thermal expansion. - The melting of land ice, ice sheets and glaciers.
In this case, the surplus of meltwater that flows into the ocean increases the sea level.
How do we measure and monitor sea levels ?
Since the 19th century
- For 150 years, sea level changes have been measured by tide gauge stations usually located along continental coasts or on islands. Some stations saw the light even earlier, like the one in Brest in 1807, which gives us more than 200 years of data. Tide gauges are fixed installations, historically created to refine the study of tides, but they also provide data on the evolution of sea level. However, given that they are attached to the ground, they also need to measure ground movements to account for variations in ground levels. Therefore, in coastal areas, sinking land leads to higher sea-level.
- Since the early nineties, altimetry satellites such as Topex/Poseidon and its successors Jason 1, 2, 3, etc. measure ocean topography and thus sea level variations using an onboard radar. Both methods are complementary: tide gauges give us informations on coastal areas while satellites cover the entire ocean and provide us with data on the high seas.
Once these measures are compensated by changes in the height of the land, both measurements offer remarkably similar results. Climate deniers constantly challenge the validity of these observations. They doubt the fact that it is possible to obtain millimeter-level accuracy (around 1mm/year) from orbit. Yet, precise measures of global sea levels from space are corroborated by either tide gauge data, or by estimated contributions from thermal expansions or additional water from melting land ice.
- Scientist measure the ocean’s rising temperatures (especially thanks to the international Argo float network, a system of around 4000 autonomous buoyant floats which measure temperatures from the uppermost 2000 meters of the world’s oceans) and also monitor, with the help of satellites, the evolution of the land ice’s volume and mass in order to estimate the amount of additional water discharged into the oceans.
Thanks to these two measurements, we can get reliable estimates of the elevation observed these last three decades.
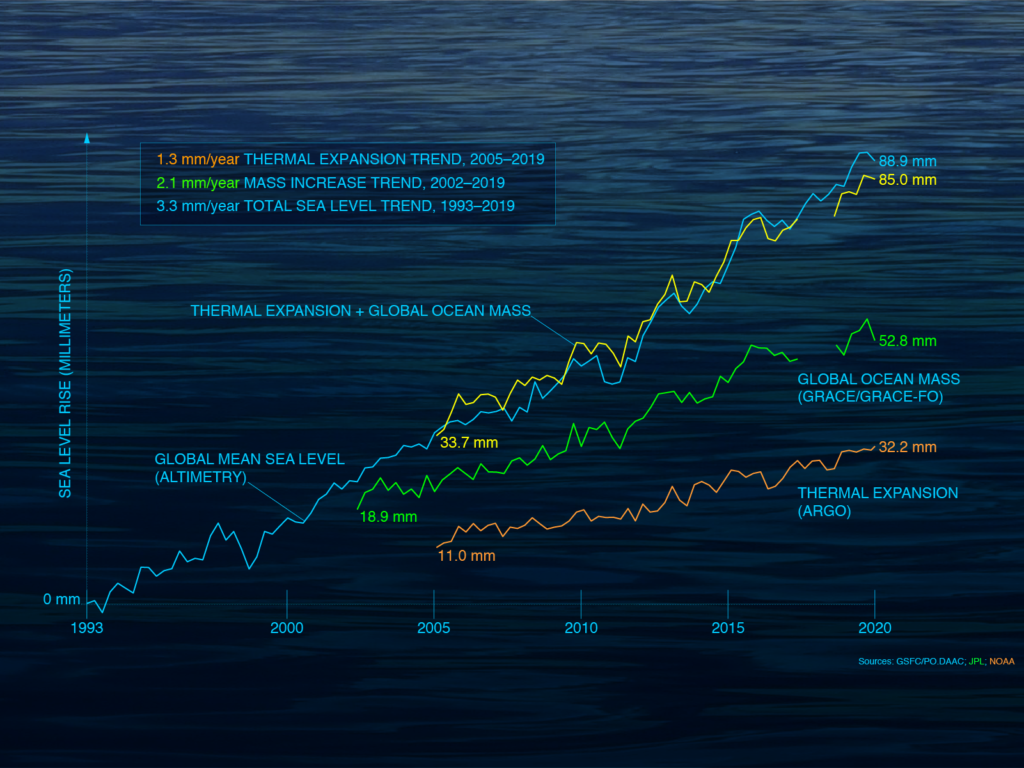
© NASA
Further in the past…
To get data on before instrumental surveys were available, local rates of sea level change are estimated indirectly from sedimentary, fossil and archaeological records. Coral reefs are a particularly interesting case: they need a lot of light to thrive, and mostly live between surface levels and ten meters depth.
As the sea rises, the reef takes over the continental slope, and ancient corals die due to a lack of light. The upper 10 to 15 meters of atolls are remnants of the reef growth that ocurred during the Holocene (the actual geolocial epoch, which started around 12 000 years ago, at the end of the last ice age).
Have ocean levels always varied ?
Even if sea levels have been holding steady for most of the last 3,000 years (up until the recent rise), sea level changes have occurred throughout Earth’s history. Global sea level has know important fluctuations over the glacial/interglacial cycles of the last million years, sometimes of up to 100 m difference. But those were natural phenomenons, spreading out over large time scales (around 100 00 years) compared to the rapid pace of current sea level rise, which is caused by human activities.
What is the current situation ?
Over the past century, we’ve been observing a steady rise in levels. During the 20th century, global sea levels rose around 1.7 mm per year on average. The rate of sea level rise has almost doubled during the last two decades. According to a report published in April 2021 by the World Meteorological Organization (WMO) on the state of the global climate in 2020, the global mean rate of sea-level rise is around 3.3 mm/yr (from 2.2 mm/year at the end of the 1990s and hovering around 4mm/year these last few years).
If you’re not worried about a sea level rise which corresponds to around three credit cards stacked on top of each other, then maybe this figure will help: it’s around 1.18 trillions (1,18 x 10 12) cubic meters of water per year.
So what ? It’s not like this never happened before…
Yes ! Actually, we think that between glacial and interglacial periods, the average rate was around 10 to 15 mm/year. However, we must not lose sight of the fact that these are specific and natural phenomenons, which occur following particular circumstances: the transition from an entirely glacial period to interglacial conditions.
Climate deniers often argue that global sea levels were once about 120 meters lower in the past. During the last ice age, it took around 80 000 years for this to happen, and 12 000 for global sea levels to go back to their original levels (before the industrial revolution). The current rise is of around 1 to 2 meters in only 100 years. Even tough the pace at which these changes occurred were similar (around 1 cm/year), the causes are radically different.
Sometimes, the sea level goes down, like in 2010.
It’s true that the average global sea level slightly went down in 2011. But that was temporary, and we understand what’s behind it: during El nino ou La nina events, there’s a period of about 18 months during which the sea level varies slightly. When an El nino event occurs, it rains less on land (especially on the Amazon basin) and more on the tropical Pacific. As a result, the sea level rises.
During an La nina event, the opposite happens (less rain on the tropical Pacific, and more over the tropical basins of the continental regions). That’s what happened in 2011 during the La Nina event. More generally, high-frequency sea level oscillations occur because of natural phenomenons, like the one described above, which superimpose on the global average rise in sea level recorded in recent decades.
For instance, in Brest, where observations from tidal gauges have started as soon as 1807, estimations clearly point towards a global upwards trend. But these fluctuations can vary from ± 5 cm from year to another. That’s why long observations periods are need to get an overall idea of the trend .
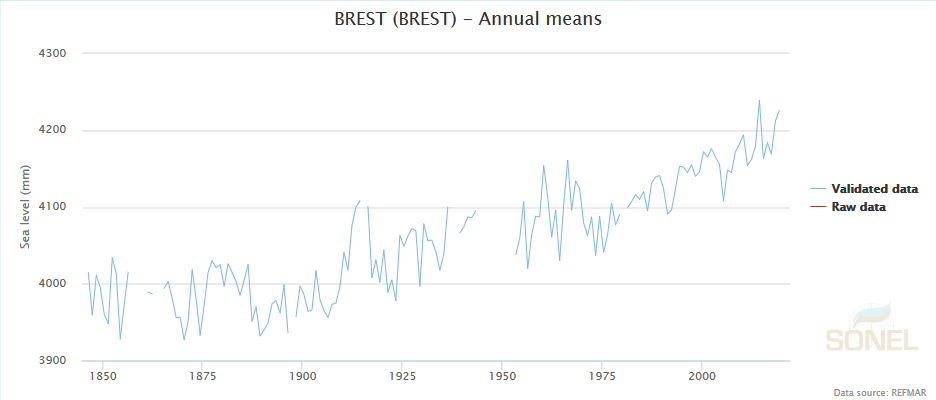
Because sea level rise is an important signal for tracking climate change, deniers often use this argument. But the sea level isn’t rising constantly. Therefore, it’s possible to cherry-pick a specific chunk of data which suggests – deceivingly – the overall trend is flat, or even going down…

However, in some places sea level is rising more quickly than others, and the opposite is also true !
The entire planet is not equally affected by rising sea levels, mainly because the heat of the world’s oceans is not homogeneously redistributed by the ocean circulation.
in some regions, it is rising more quickly than others, and in some places, sea level is slower. For instance, in the western Pacific, sea level rise was 2 to 3 times faster than the average rate over the last 30 years. Fidji islands are infamous for being one of the main victimes of sea level rise. Already in the mid-2000s, some villages had to be relocated because of climate change. As previously mentioned, at the local scale, sea level rise also depends on other processes related to the increase in temperatures.
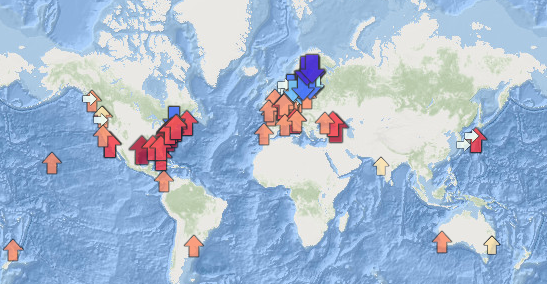
This map, which stems from the European Atlas of the Seas, shows sea level variations (in millimeters per year) relative to ground levels along European coastlines. Sea levels are rising along the Atlantic, Mediterranean, North Sea and Black Sea coasts, but not in Scandinavia.
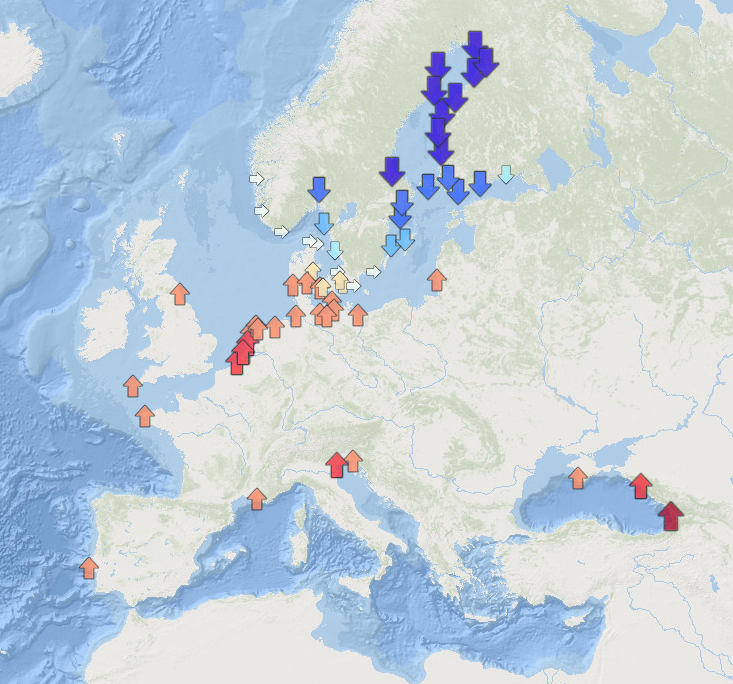
However, by taking a step back, it’s obvious that there aren’t a lot of places with blue arrows. Note that in these places, the relative sea level is going down. In Scandinavia, the terrestrial crust has been rising as the result of the previous deglaciation … and consequently the tide gauge measures lower sea levels, even though they are rising !
Why is the global sea level rising ?
Because of the rise in global temperatures.
There is a large consensus among the scientific community that this phenomenon is linked with the average global warming of the climate observed during the same period. Remember, we mentioned two main drivers of sea level rise: the melting of land ice, ice sheets and glaciers, and thermal expansion which is a consequence of warming oceans.
However,
- in a previous article, we mentioned that the melting of glaciers is accelerating.
Using satellite data, this new study published in may 2021 (which, to this day, remains the most complete and accurate of its kind) shows that, since 2000, almost all glaciers in the world are thinning and losing mass.
- According to the previously cited WMO report, Antarctica is losing between 175 to 225 Gt per year, due to the increased flow of major glaciers in West Antarctica and the Antarctic Peninsula. (A loss of 200 Gt of ice per year is about twice the annual flow of the Rhine in Europe)
- We observed the increase in marine temperatures. According to the IPPC’s special Report on the Ocean and Cryosphere (2019):
“It is virtually certain that the global ocean has warmed unabated since 1970 and has taken up more than 90% of the excess heat in the climate system (high confidence). Since 1993, the rate of ocean warming has more than doubled (likely). Marine heatwaves have very likely doubled in frequency since 1982 and are increasing in intensity (very high confidence).“
It’s because of human activities
It is now an established fact that climate change is due to greenhouse gas emissions (mostly CO2) emitted by human activities (industries, transports, domestic needs, deforestation, etc.). This leads to a surplus of heat of which around 90% is stocked in the ocean (that’s why the ocean is warming). The rest of this heat is melting glaciers and heating up the atmosphere.
In addition, there is a second, lesser reason, which is related to aquifer overexploitation (groundwater in particular). Simply put, we draw water from the soil which ends up in the sea once it’s been used. However, some aquifers are non-renewable, or renew over very long periods of time.
Couldn’t it be related to solar activity?
When the sun is getting warmer or cooler, the Earth’s climate does as well, with a 10-year lag. Maybe we are on to something.
However, solar activity has remained stable for the last 50 years. Furthermore, a study showed that since 1975, solar activity does not correlate with climate anymore. At that point, temperatures started to go up even though solar activity was stable.
Couldn’t this be related to tectonic or volcanic activity?
Large volcanic eruptions cause a temporary cooling of the Earth (and therefore of the ocean). This can lead to a temporary lowering of sea levels, something that was observed following the Pinatubo eruption in 1991. But it didn’t last more than 2-3 years.
What are the projected global sea level rise levels in the following years according to climate scientists ?
The ocean’s accumulated heat is transported by slow ocean currents from the surface to the bottom and from one region to another. It will stay there for several centuries! One detail of importance: the next ice age will not happen before 50,000 years!
Until then, the sea will continue to rise because of the increase in temperatures.
Even if we stop emitting CO2 tomorrow, warming will continue for several centuries and the sea will continue to rise… But less than if we continue to emit CO2 at the same rate as we are today!
Future sea level rise therefore depends on our future greenhouse gas emissions. However, it’s much more difficult to predict the contribution of ice cap melting the global sea level rise in the following decades, especially because of a possible abrupt ice sheet collapse of the unstable West Antarctic region (and to a lesser extent in Greenland). This issue is the subject of intense research.
Who do the models say ?
According to recent modeling studies, the Antarctic Ice Sheet may account for up to 30 cm of sea level rise in 2100, and maybe much more (up to 1 meters) according to some scenarios. The uncertainties behind this number mainly reflects a lack of knowledge of melting that occurs on the bottom of ice shelves. However, these floating glacial fringes, which can cover an area up to half the size of France, keep in the rest of the ice sheet.
In any case, recent observations point to an acceleration of the contribution of Greenland’s and West Antarctica’s ice shelves to the current sea level rise.
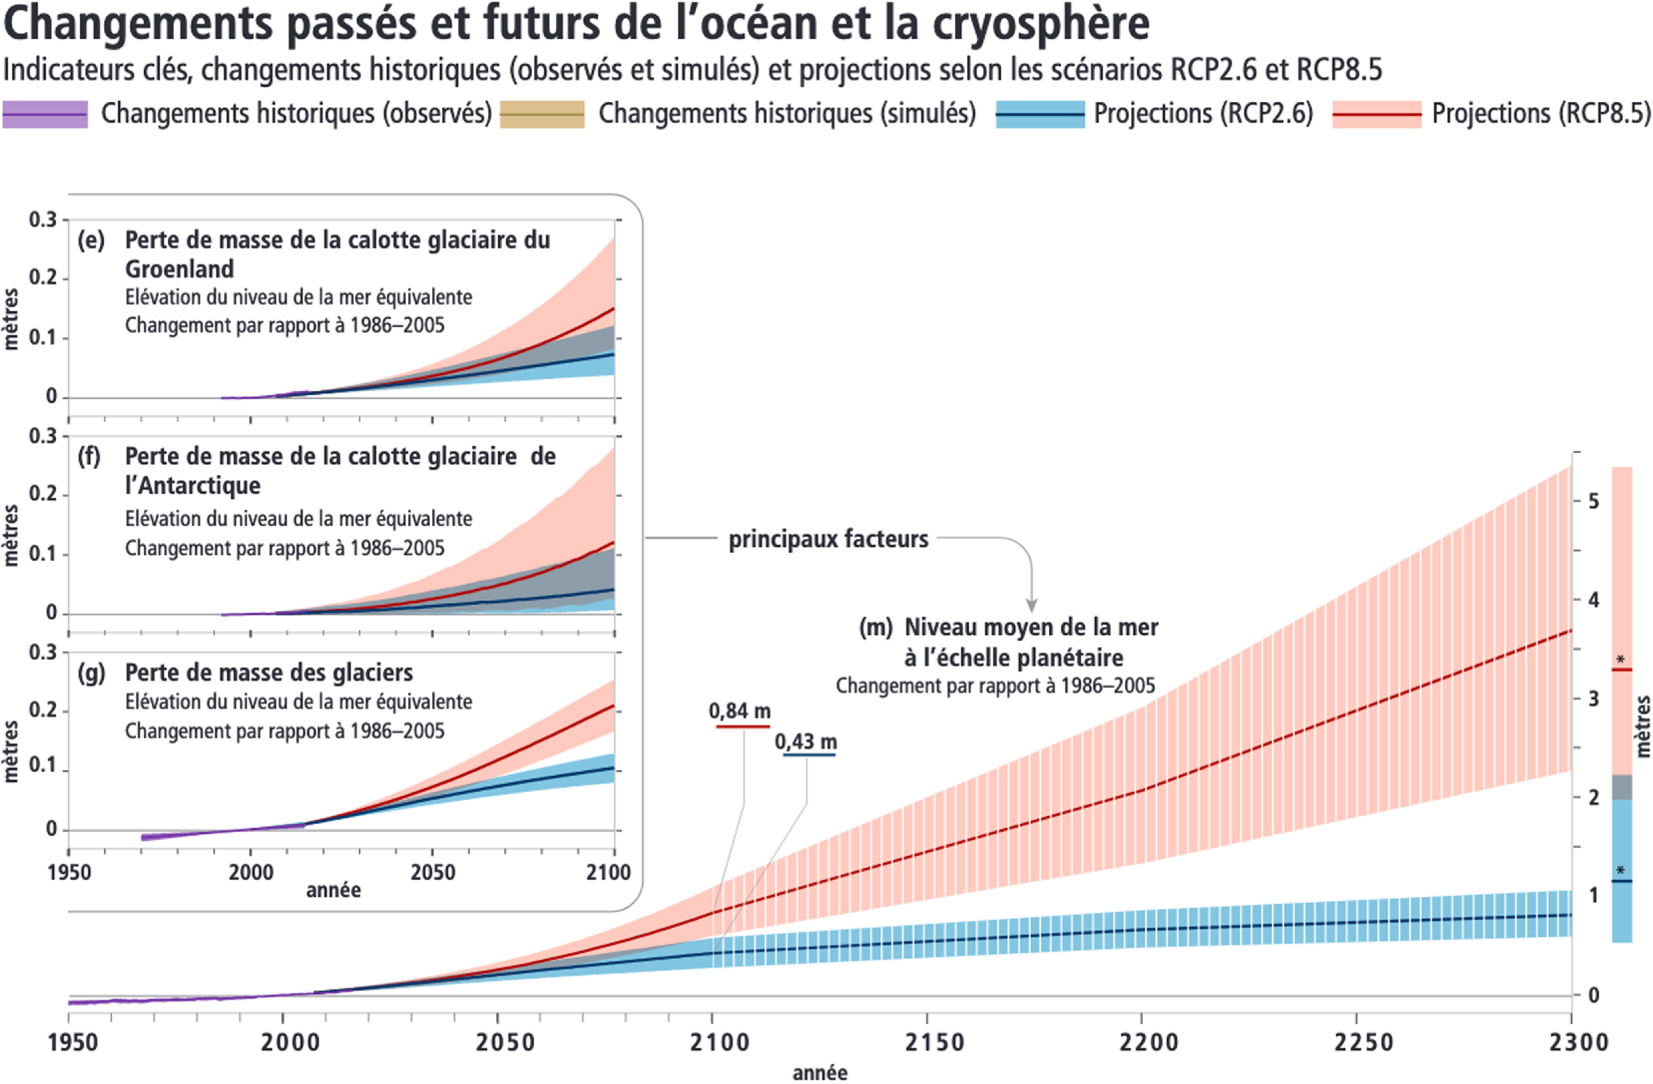
Even though there are uncertainties, according to the IPPC’s special Report on the Ocean and Cryosphere, researchers estimate that by 2100:
- 15 to 55% of the current mass of glaciers is projected to disappear according to the RCP 2.6 scenario.
- 35 to 85% according to the RCP 8.5 scenario
According to all RCPs, it’s highly likey that sea level rise will happen at a much faster rate than the one observed between 1971 and 2010, due to increased ocean warming and mass loss from glaciers and ice caps.
Under the most optimistic scenario (RCP 2.6), the projected global sea level rise is projected to be 0.43 m in 2100 compared to between 1986 and 2005.
The sea is rising, so what ? What are the impacts of sea level rise ?
If current rates of global sea level rise persist over time, there will be severe consequences for low-lying, densely populated coastal areas, where even a slight rise in sea level can produce extensive inland flooding.
Some object that sea level has always changed and that this didn’t stop the earth from spinning. However, the planet is much more populated today than the day we crossed the English Channel on foot. But more importantly, the rate of sea level rise is unprecedented in Earth’s history !!!! Many towns, people and entire economies can be impacted by sea level rise.
Many unknowns remain about the extent of sea level rise, but the consequences are unfortunately relatively predictable: retreat of the coastline, disappearance of certain islands, intrusion of salt water into freshwater aquifers close to the coasts, destruction of coastal ecosystems, biodiversity loss, more devastating storms and cyclones, more frequent flooding. Local sea level extremes that historically occurred once per century are projected to occur at least once per year for most coastal regions during the 21st century. The economic and human cost cannot be ignored.
Sea level rise sometimes amplifies other phenomenons linked to climate change (increasingly violent cyclones) or related to human activities (such as land sinking due to groundwater pumping, oil and gas extraction, mining, etc).
What about France ?
In France in 2018, more than 250,000 people were estimated to live within 500 m of eroding coastlines. About 200,000 people live within one kilometer of the sea, in low-lying areas which are threatened by flooding. If the scientists’ projections are correct, some low-lying French coastal areas (Flanders, Vendée, Saintonge, Camargue) will also be impacted.
Coastal deltas, islands, and low-lying coastlines are particularly at risk of submergence of land and storm damage.
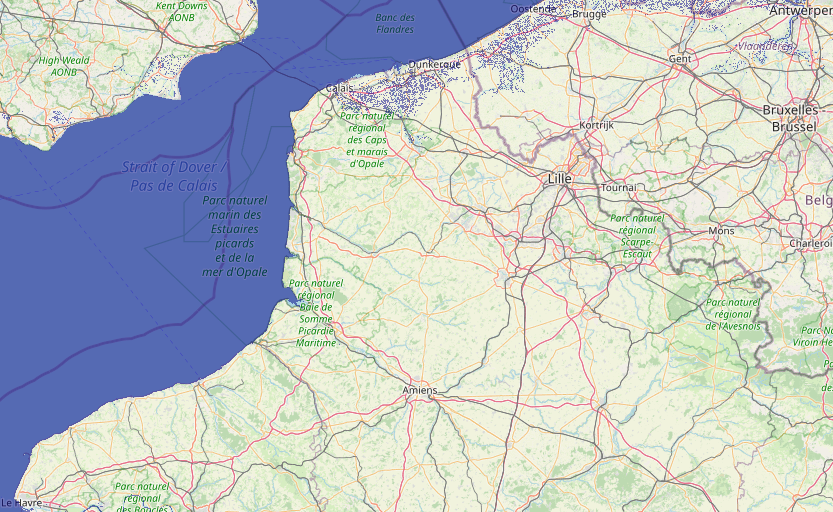
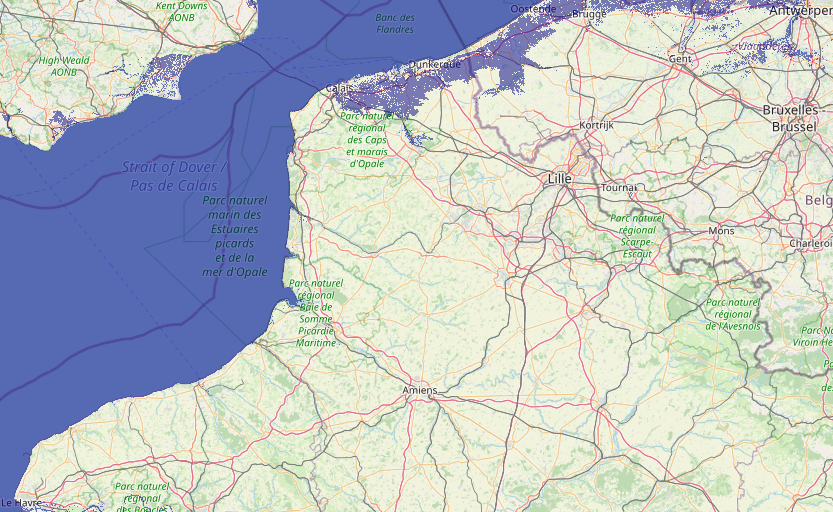
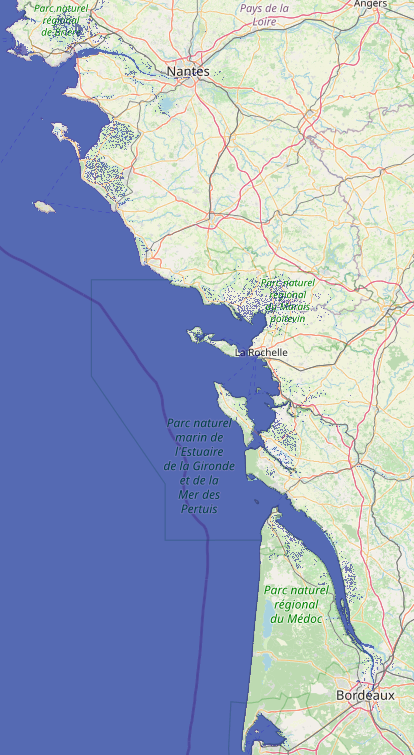
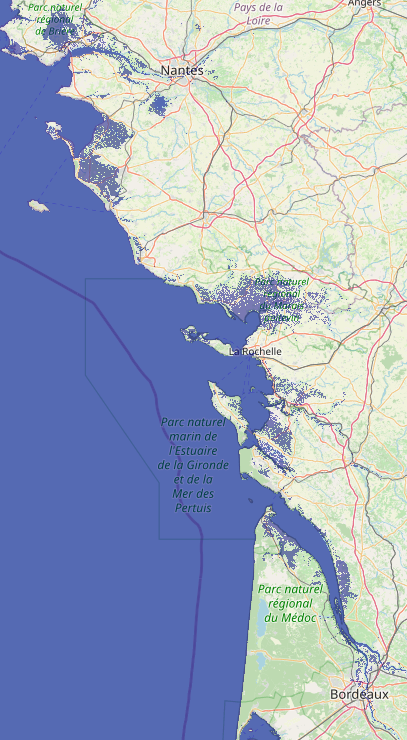
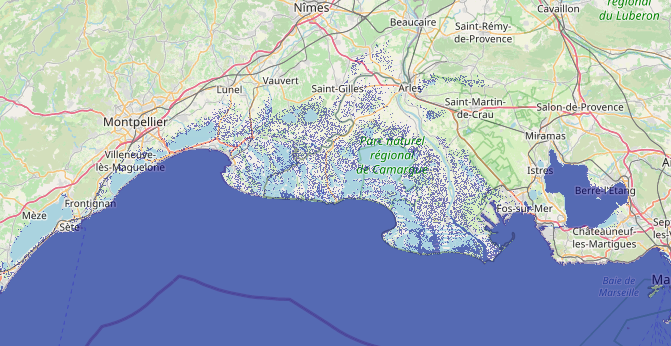
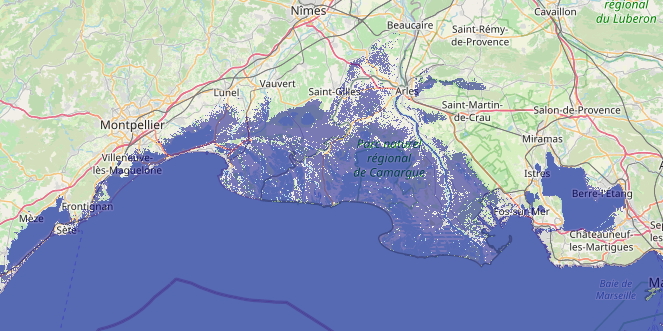
Here, you can see areas threatened bu flooding according to the height reached by sea level for three French regions (on the left, the current level, on the right with a sea level 1 meter higher than the current level (top, Flanders, middle, the region between Nantes and Bordeaux, bottom, the Camargue).
Source : http://flood.firetree.net/
Estimating regional sea level rise is challenging for researchers. As we have seen, it is necessary to take into account land sinking phenomenons due to tectonics or water pumping from aquifers.
Other factors, such as the decrease of sedimentary contributions to the sea by rivers, caused by the construction of dams, the intensive urbanization of the coastline, the modification of coastal currents, etc. also influence coastline morphology.
The last word
- Over the past century, we’ve been observing a steady rise in levels. The average of sea level rise is now around 3.3 mm per year, and is accelerating.
- It is mainly attributed to two phenomenons: the melting of land ice, ice sheets and glaciers, and thermal expansion which is a consequence of warming oceans. These two phenomenons are a consequence of anthropogenic activities.
- According to even the most optimistic scenarios, which are also the less likely, the global sea level could reach an additional 0.43 m by 2100. But most climate scientists think that an increase of 1m compared to the early 2000s is not to be ruled out.
- Sea level rise will have severe consequences for low-lying and densely populated coastal regions.
Read more about it
Is the level of the oceans rising? (on the site Le climat en questions)
Thread of climate scientist Valérie Masson Delmotte, after the release of the SROCC
A tool to visualize which cities will be underwater, depending on the level of warming