

For the last article in our series with the CNRS, we are going to Antarctica, more commonly known as “the white continent” or “the 6th continent“.
Antarctica is fascinating in every way. Firstly, few people will have the chance to go. Indeed, unless you work for science or are a wealthy tourist who likes to walk around in a -30°C weather, there is very little chance of finding a selfie of you on the Pine Island glacier. But why should we be interested in what is happening 15,000km away from metropolitan France?
The answer is similar to the one we could have given for each article so far. Quite simply: if we don’t care about Antarctica, Antarctica will care about us. Strange as it may seem, Antarctica does have one thing in common with the Amazon: they are both subject to a possible climate tipping point. In the case of Antarctica, this point of no return could have global consequences for hundreds of millions of people, including in France!
In this article we will (try to) answer several questions: what are the consequences of the loss of mass of the Antarctica glacier ? Will there be one or more tipping points? Can we still avoid the worst?
To answer this question, we received the help of Catherine Ritz, CNRS research director at the Institut des Géosciences de l’Environnement (IGE).
Sommaire
Antarctica, the only continent (almost) spared by man
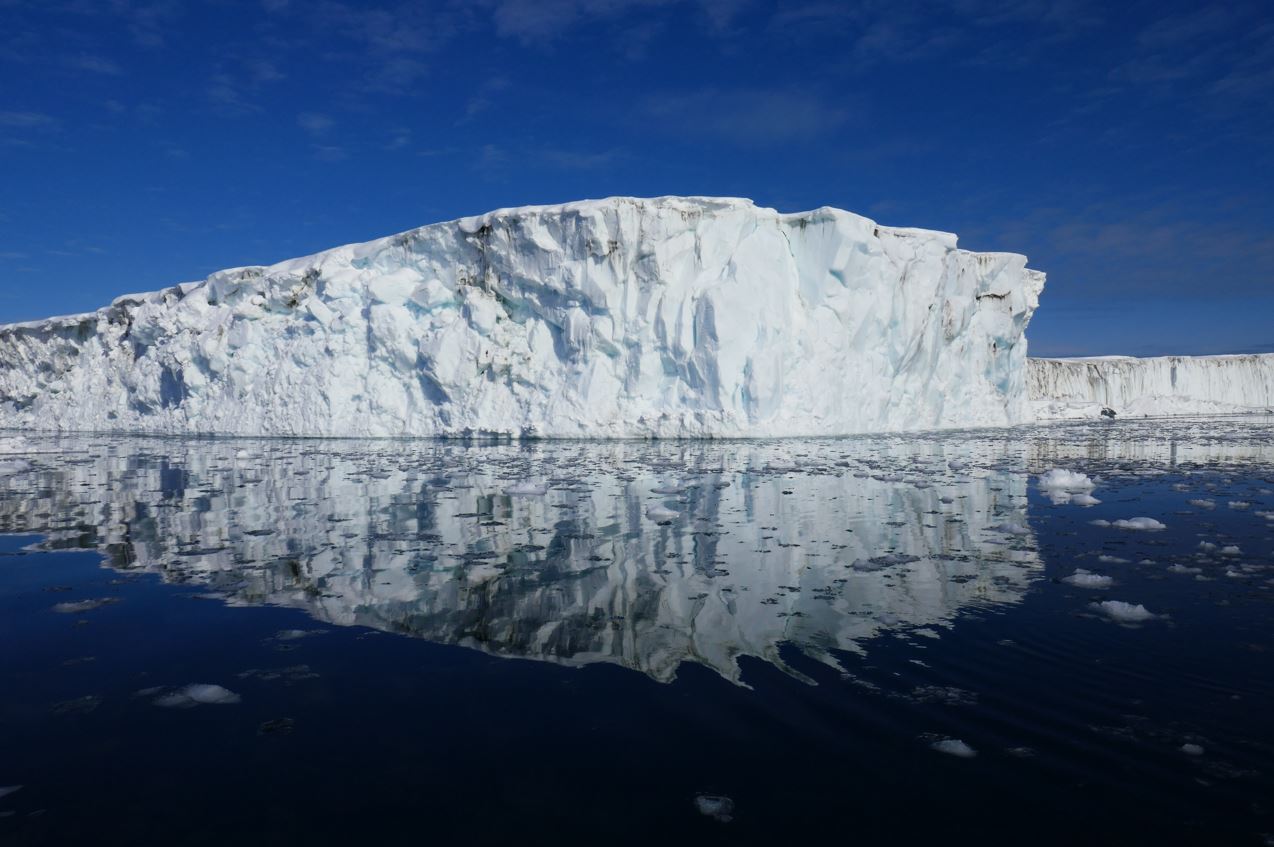
Officially discovered in the 19th century, Antarctica has not ceased to attract interest and excite the imagination. Probably, among other things, because this continent is unknown to most people. It is the driest, coldest and windiest continent in the world. The average temperature is -20°C during the southern summer, and about -60°C the rest of the year. In Antarctica, if you lose a glove, you lose a hand.
Of course, speaking on average for a continent like Antarctica is not necessarily representative of the different climates in each region. The climate is very different between the Antarctic Peninsula, where the record heat was recorded in the summer of 2021 at 18.3°C… and the Vostok station, almost at the top of the dome, with 3.7 km of ice under its foundations, which recorded a nice -89°C in 1983.
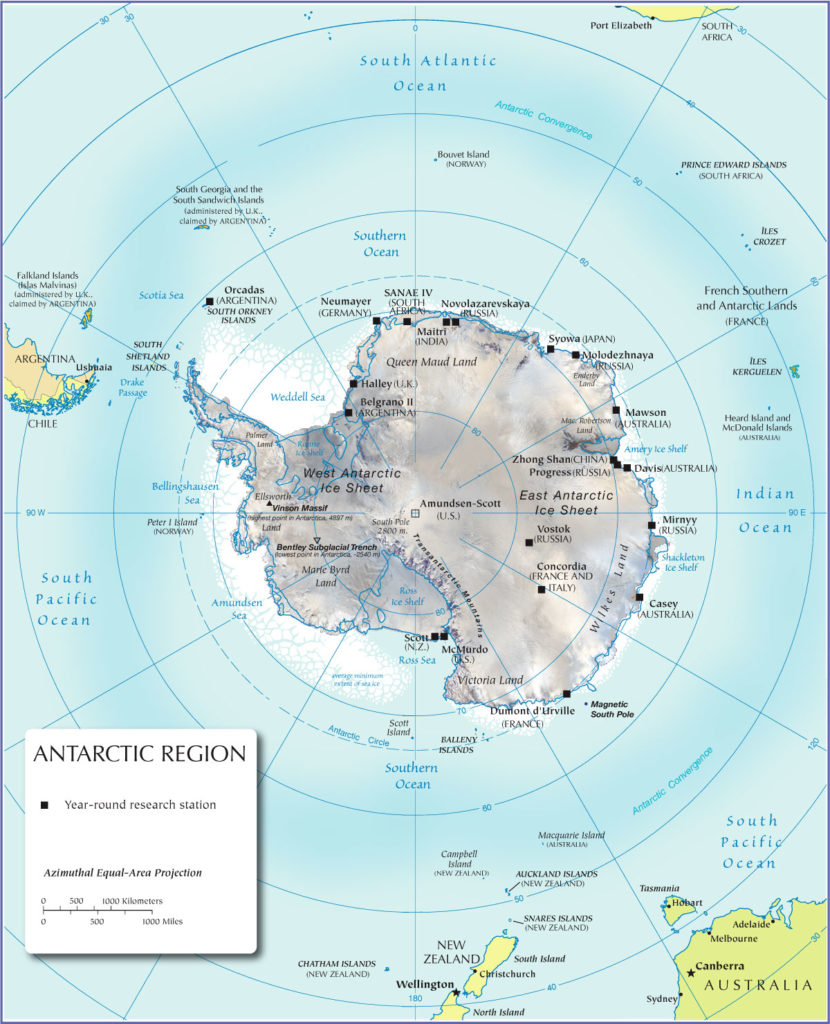
Located around the South Pole, it is surrounded by the Atlantic, Indian and Pacific Oceans (above 60° South, it is called the Southern Ocean) and the Ross, Amundsen, Bellingshausen and Weddell Seas. East Antarctica is accessed via Australia, New Zealand or South Africa and West Antarctica via the tip of South America, where most of the tourist flow is concentrated.
Orders of magnitude
Only a few orders of magnitude can give an idea of the immensity and exceptional nature of Antarctica:
- An area of 14.2 million km² of ice, about one and a half times the size of Europe and 27 times the size of France. In winter, due to the extent of the ice pack, the ice area is around 30 million km².
- 98% of the surface is covered with ice.
- The continent contains about 80% of the world’s freshwater reserves (which is becoming an economic and therefore geopolitical issue).
- The average altitude is very high (especially in East Antarctica): the continent is covered by an ice cap with an average thickness of about 2,160 metres (rising to 4,897 metres), and a volume of 30 million km3.
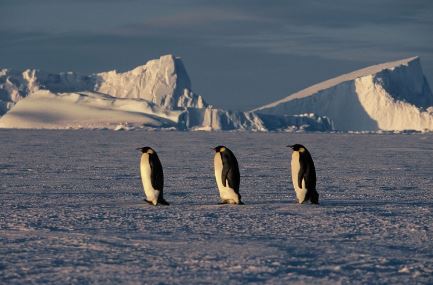
- Biodiversity is limited, as few organisms can survive in such harsh conditions. A particularity of the Antarctic is that the entire food chain is based on a single species of invertebrate, the krill. By the way, and contrary to the Arctic, there are no polar bears in Antarctica (rather good news for the penguins, less tense during the walk)
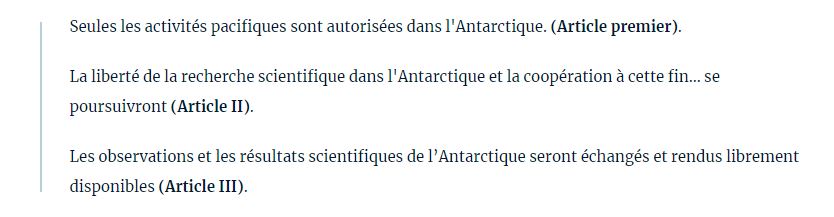
To avoid further massacres of species as was the case by the Europeans in the 19th century, the continent is protected by the Commission for the Conservation of Antarctic Marine Living Resources (CCAMLR). Although the continent is protected, this does not allow for living in Antarctica: there are no indigenous peoples. If you are there, chances are you are either a scientist (or working in a science centre) or a tourist.
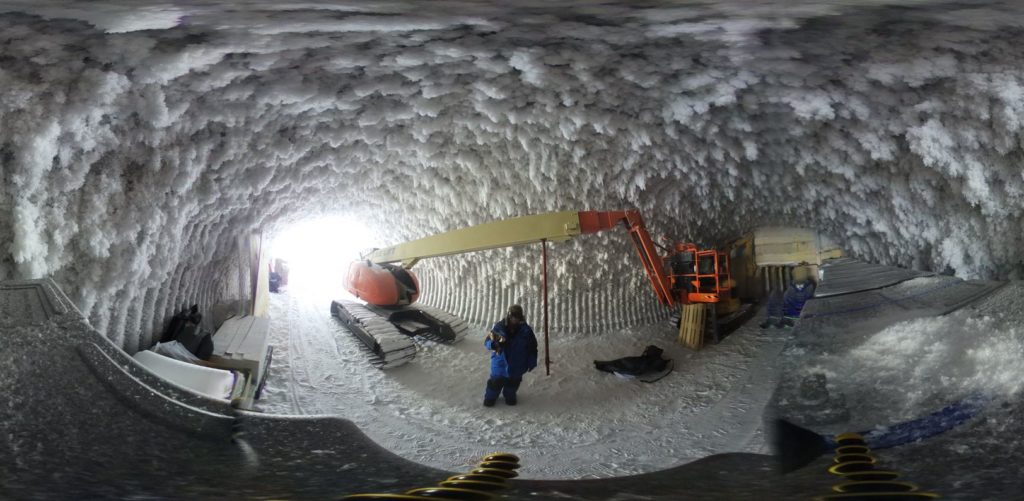
Credit : Catherine Ritz for IPEV/IGE
Tourism? In Antarctica?
In addition to being difficult to access, Antarctica is a dangerous continent. Not the kind of place you would go to without care, without preparation. Unfortunately there are regular accidents and many scientists and logisticians have lost their lives.
Despite this, tourism is booming. Tourism for the ultra-rich, mainly on large cruise ships in the peninsula area. On average, each tourist emits 5 tonnes of CO2 to get there. Should we put this in perspective, as the number of tourists is low? Well, not so much.
There were 3000 tourists in 1990, the figure is 74000 in 2019, with a 40% increase in that year alone. Here we find the famous “it is by being here that I realise the fragility of our environment and few people should come here“. As touching as a Jeff Bezos who realises, once in space, that the Earth is fragile.
The Antarctic Treaty: Terra nullius
One of the things that makes Antarctica unique is its geopolitical history. Since the middle of the 19th century, many countries have tried to claim ownership: Chile, Argentina, Australia, New Zealand (territorial proximity), and other countries such as Norway, France or the United Kingdom, in a spirit of conquest and exploration.
To avoid conflict (simplified version, it’s a bit more complicated), the Antarctic Treaty was signed in Washington on 1 December 1959 by the twelve countries whose scientists had engaged in activities in and around Antarctica. It came into force in 1961. Since then, a large number of other nations have joined, bringing the total number of parties to 54 today.
Important provisions of the Treaty include the following:
In addition, the Antarctica Treaty Consultative Meeting (ATCM) meets annually to oversee the management of the continent, including the 80 scientific bases. Since 1991, Antarctica has been recognised as a nature reserve and a territory of peace and science! Everything is highly regulated and no country (normally) can choose to suddenly explore or exploit any part of Antarctica, build a base anywhere, etc.
Several safeguards were introduced, including the need for a unanimous vote of the 26 signatory countries to the Madrid Protocol for any amendment to the text.
Credit : Catherine Ritz for IPEV/IGE
The geopolitics of the poles, whether in the Arctic or Antarctic, is fascinating. If you wish to delve into the subject, I recommend reading Anne Choquet‘s work, particularly to understand the issues at stake in the next 30 years.
“The text, passed in 1959, effectively freezes territorial claims on the continent. While the treaty “has an unlimited life”, the Madrid Protocol, signed in 1991 (at the instigation of Mr Rocard and the then Australian Prime Minister) and relating to the protection of the Antarctic environment, could be rediscussed after 2048 at the request of any of the signatory countries. It will then be a matter of states with territorial claims or a desire to exploit the continent using their influence and strength to influence the discussions.
How is the Antarctic ice cap changing?
In our article on glaciers, we saw that to fully understand the links between climate and glaciers, it is necessary to measure and analyse the surface mass balance of the whole glacier on decadal scales to analyse robust trends. Then, to fully understand what is happening in Antarctica, we need to separate two things: the pack ice or sea ice (the sea that freezes) and the ice cap (the ice sheet, freshwater ice).
Since the IPCC Special Report on the Cryosphere (SCROCC) and our article on glaciers, the latest IPCC report has extended the estimates over the last 20 years (thanks to thealtimetry and gravimetry), including data sets on the ice cap until 2020 (TS.2.5).
Thus, we know that :
- The extent of the Antarctic ice pack is rather stable. There has been no significant trend in Antarctic sea ice area between 1979 and 2020 due to opposing regional trends and high internal variability.
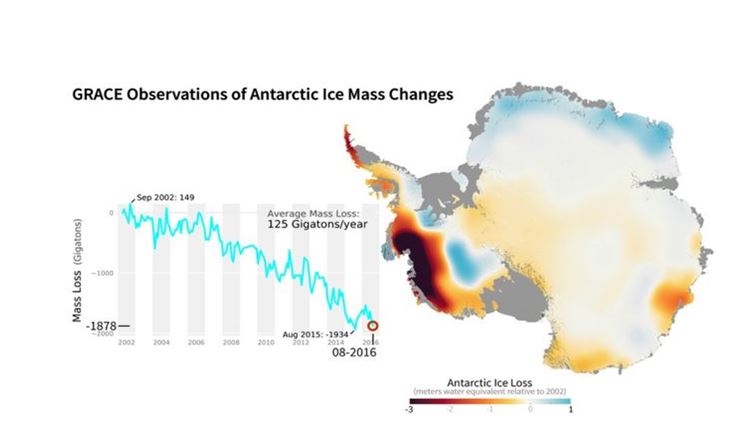
- In contrast, the ice cap, which covers most of Antarctica, has shown a strong trend of mass loss since the late 1990s. This trend accelerated around 2005, and currently Antarctica is losing about 175-225 Gt per year, due to increased flow from some West Antarctic and Antarctic Peninsula glaciers.
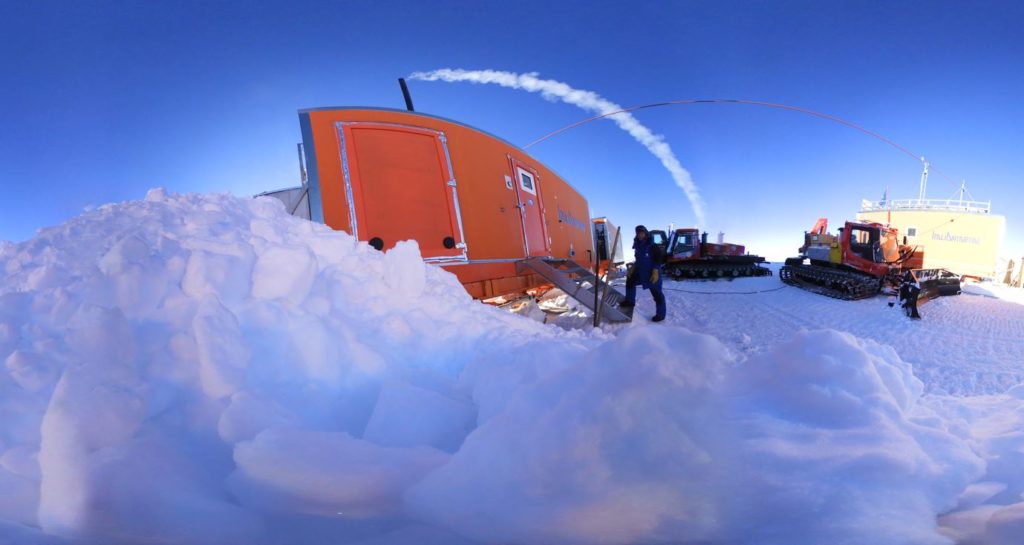
The ice shelves
In Antarctica, the low atmospheric temperatures do not allow for run-off and it is mainly the dumping of icebergs that causes mass loss. All around the ice cap, the ice flows in the form of ice rivers that float to the ocean and form ice shelves (see “ice shelves” on the map).
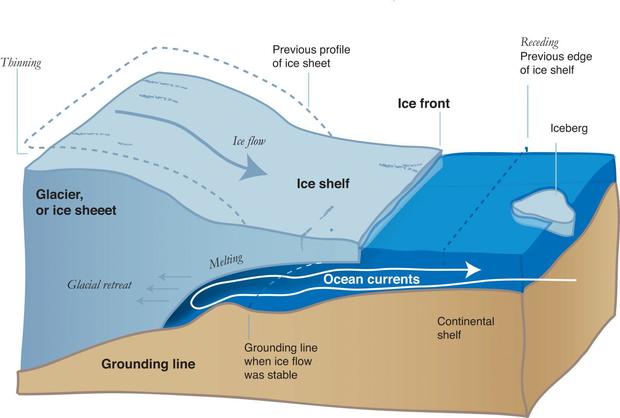
These can be several hundred metres thick near the grounding line (the boundary between the landed and the floating part) and then become thinner as they move out into the ocean. These platforms are particularly vulnerable to global warming: meltwater from the surface can seep into the crevasses and deepen the fractures (hydrofracturing); on the other hand, the base, at the interface with the ocean, melts under the action of the heat provided by the ocean, which thins the platform.
Marine ice sheet instability (MISI) and marine ice cliff instability (MICI): what are they?
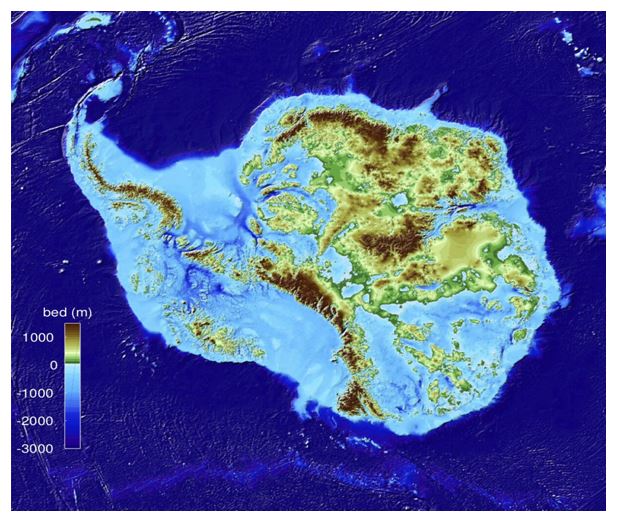
At least one third of the Antarctic ice sheet is a “marine ice sheet”, i.e. it lies on bedrock below sea level. This feature makes the overlying ice cap vulnerable to dynamic instabilities that have the potential to cause rapid ice loss.
Based on the work of Mathieu Morlighem
Marine Ice Sheet Instability (MISI)
Marine Ice Sheet Instability (MISI) is a self-sustaining retreat of the grounding line in areas where the bedrock slopes into the cap. This instability is triggered by the thinning or collapse of a floating ice shelf. The reduction of the buttress effect exerted by this platform accelerates the flow of ice rivers located upstream (tributary glaciers), a phenomenon already observed when parts of these platforms detach.
The feedback loop (the vicious circle) is as follows: the increased flow causes a loss of mass with a lowering of the landed ice surface which geometrically moves the grounding line (defined by the waterline) back. Due to the slope of the bedrock, the thickness of the ice at the new grounding line is greater.
As the ice flow at the grounding line is very strongly dependent on thickness (about power 7) the flow is further accelerated which leads to a further retreat of the grounding line. Satellite and modelling data suggest that MISI is underway in West Antarctica in the Amundsen Sea.
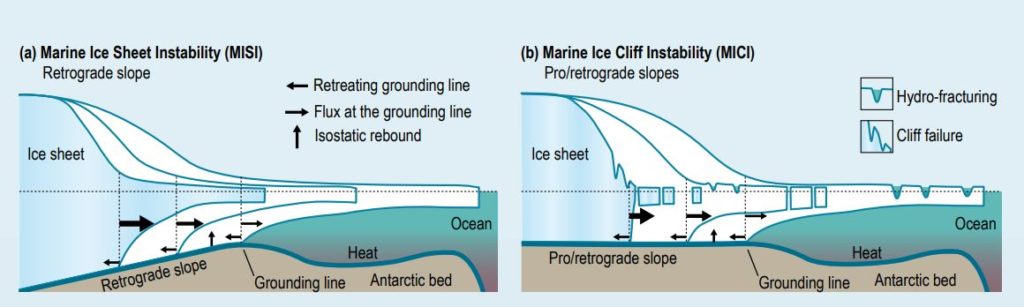
and b) sea ice cliff instability (MICI,
Source: SROCC Figure CB8.1 Pattyn (2018).
Marine Ice Cliff Instability (MICI)
The other suggested instability, that of the ice cliffs, is also located at the grounding line. If a floating ice shelf disappears completely, what remains at the grounding line is a high ice cliff that is structurally unstable once it exceeds 100 m above sea level (equivalent to a bedrock at about 900 m below sea level).
The collapse of this cliff leaves behind another cliff which is also unstable and the retreat spreads towards the interior of the cap. This process requires hydrofracturing (enlargement of crevasses by surface meltwater). The observational evidence for MICI is indirect (rapid retreat of some glacier fronts) and this process (or at least its speed) is much debated in the scientific community.
In both cases (MISI and MICI), we see that the health of the floating platforms is crucial. It is linked in particular to the warming of the ocean but also to the intrusion of warmer currents.
The most pressing concern appears to be in West Antarctica, namely the Pine Island and Thwaites glaciers. A paper published last autumn highlighted the rapid development of damaged areas on the ice shelves of these two glaciers over the past decade, causing structural weakening that, according to the authors, “prepares these ice shelves for disintegration”.
Source : Nasa.gov

What are the projections for the evolution of the Antarctica ice cap?
Regardless of the climate scenario considered, the evolution of the glacier in the coming decades is in part already established due to the inertia of the climate system and the very slow response time of glaciers to climate change. Its ice loss will therefore continue irreversibly until the middle of the 21st century.
For the second half of the century, climate change will depend on the greenhouse gas emission pathway that is followed now :
- Glacier decline will continue at an accelerated rate after mid-century if emissions remain at current levels.
- On the other hand, a sharp reduction in greenhouse gas emissions and global carbon neutrality by about 2050 would limit mass loss, although we are not sure that carbon neutrality will stop mass loss altogether:
Source: Technical Summary AR6 (the text is diagonal and is kept deliberate as the text is subject to editing)
What are the consequences of the Antarctica ice sheet loss od mass ?
Not only are the consequences of ice sheet mass loss many and varied, but they can potentially affect hundreds of millions of human beings. The main consequences are as follows:
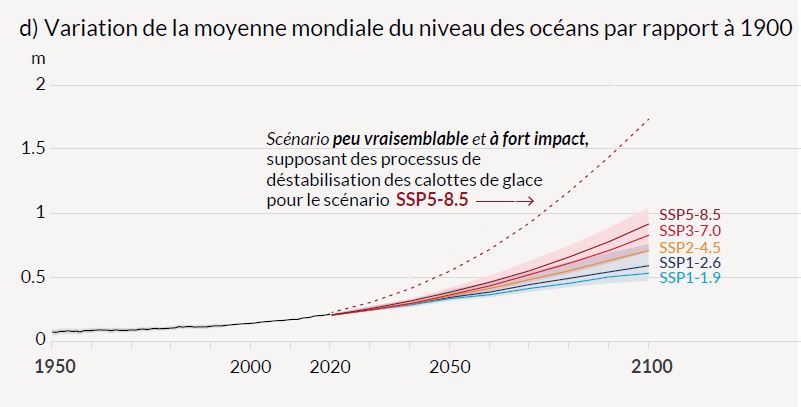
1/ Sea level rise
Rising sea levels are the main impact of melting continental ice, glaciers and polar ice caps. Although this rise is a fact and is not in doubt until the end of the century, there is uncertainty about the future level of sea level rise, which will depend on two factors.
Firstly, the level of future emissions. This is a global issue, not a local one: it is not the few thousand people in Antarctica that will influence its evolution.
Secondly, the contributionof the polar ice caps to sea level rise in the coming decades, particularly due to a possible runaway collapse in the unstable West Antarctic region. This is generally considered to be the greatest source of uncertainty in sea level rise projections.
There are a growing number of studies on the subject, and it is important to look at the time scale. This is how you will see headlines in the press like “sea level rise of more than 15 metres!” without specifying that it is a potential increase and, above all, on the horizon of 2500, even over several millennia. On the other hand, this long-term increase depends on what we do in terms of reducing greenhouse gases in the next few decades.

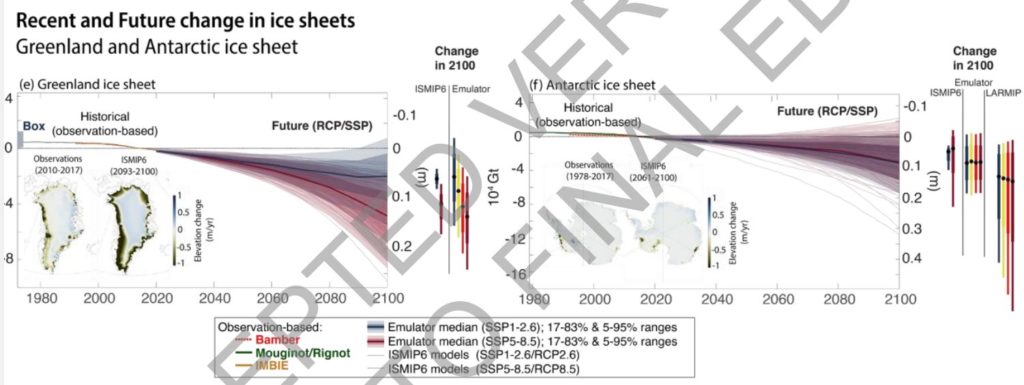
Source : AR6 WG1 Fig. 9.30
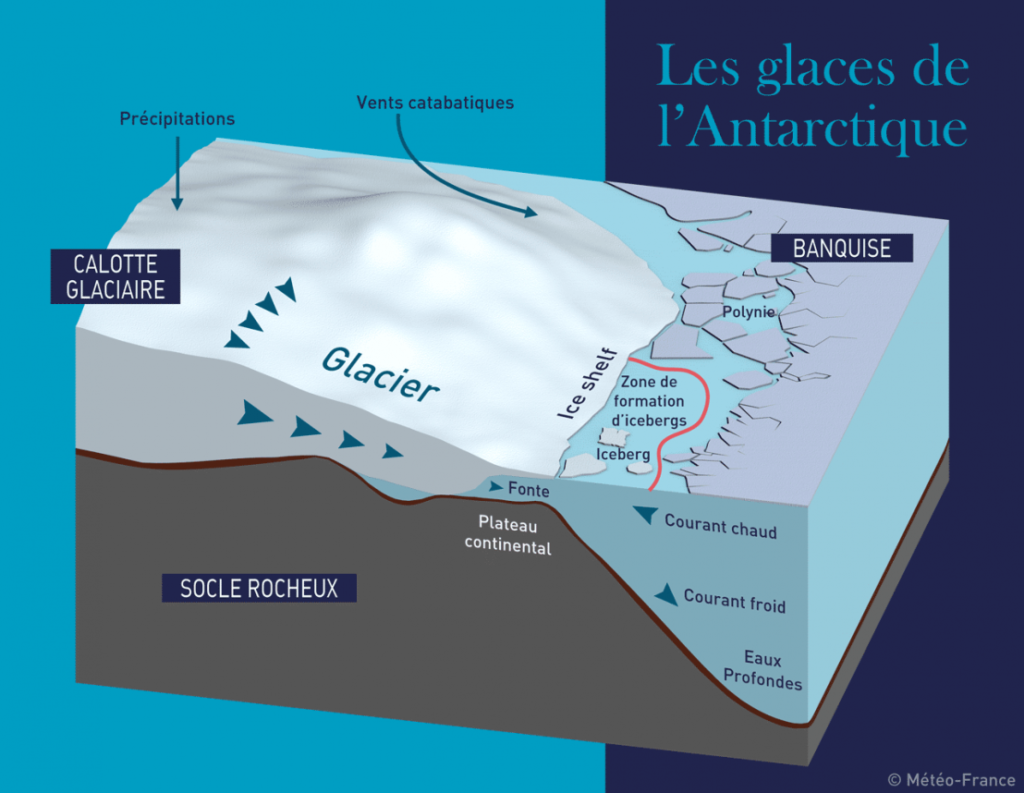
According to the IMBIE team, Antarctic mass losses account for 4 mm of sea level rise between 1992 and 2011 (twenty years) and a similar contribution for the following six years, or 18% of total sea level rise for the period 2012-2017. By 2100, according to recent modelling work, the Antarctic ice cap could contribute up to 30 cm to the rise in sea level, or even much more (up to 1 m), according to some scenarios.
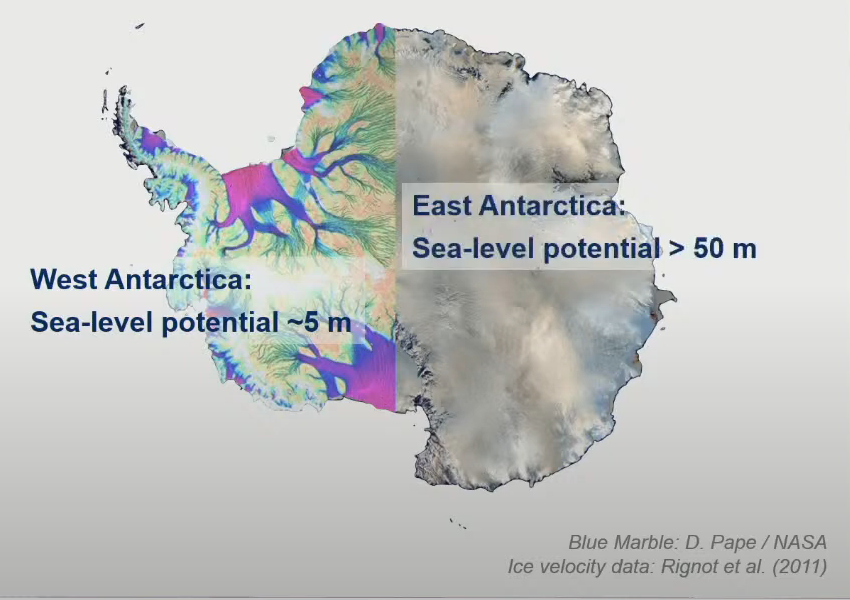
In conclusion, the potential for global sea level rise with the melting of the Antarctic ice sheet is enormous. Even if it would take several centuries/millennia to reach such levels! We are talking about +5 meters for the melting of the West Antarctic ice sheet, and about +20 meters with the underwater base of East Antarctica (50 meters in total)!
Moreover, the latest scientific publications are not very encouraging on the subject. Perhaps Anders Levermann, co-author of this article in 2020, sums it up best:
“the more we learn about Antarctica, the more dire the predictions become”… “Sea level rise due to Antarctic mass loss will be enormous even if we comply with the Paris Agreement, and catastrophic if we don’t.“
2/ Glaciers calving
Glacier calving (the production of icebergs by a glacier when masses of ice break off from the glacier at the sea front and find their way into a body of water (sea, proglacial lake, etc.) has increased with global warming. Calving is part of the normal functioning of glaciers but is not necessarily annual.
An example of an event with a long return period in 2021: an iceberg nicknamed A-76 broke off, becoming the world’s largest detached iceberg (observed). Its size is 4320km², it is as if the department of the Alpes-Maritimes was detached from metropolitan France and went for a walk…
This iceberg will drift for several years. Given its size, it is very likely to break into several pieces that will melt. It will eventually be disintegrated.
More than the size of the icebergs, it is the increased frequency of calving in Antarctica that is of concern, especially in regions likely to trigger instability.
But that’s not all…
Although sea level rise is the most obvious and worrying consequence in the short to medium term on a climate timescale, other less publicised consequences are also being researched. For example, we can mention :
- Changing thermal stratification of the seas around Antarctica: two recent studies from 2018 and 2019 suggest that a large increase in sub-glacial melt and resulting iceberg discharges could amplify the warming of the ocean underneath the ice shelves, and hence the melt.
- Weakening of the albedo effect: warming causes ice shelves to melt, which eventually changes the colour of the ocean and makes the reflective effect weaker. This is called a positive feedback loop.
- Impact on biodiversity: It may not be as rich as the Amazon, but Antarctica is one of the eight ecozones (biogeographical regions). Since all animals are dependent on the ice pack, if the ice pack melts…
Now that we have all the elements in hand, let us tackle the famous subject of the tipping point.
What is a tipping point?
Although the principle has been known to scientists for several decades, it is only recently that the term tipping point has been explicitly used. The IPCC refers to it in its 4th report for the first time, and now refers to it in every report (and special reports). In its Special Report 1.5, the tipping point is defined as follows:
The degree of change in the properties of a system beyond which the system in question reorganises, often abruptly, and does not return to its original state even if the factors causing the change are eliminated. For the climate system, the tipping point refers to a critical threshold beyond which the global climate or a regional climate moves from one stable state to another stable state.
The second very important concept is irreversibility: “a term describing the disturbed state of a dynamic system on a given time scale, when the time required for the restoration of the system by natural processes is significantly longer than the time required to reach this disturbed state“.
onclimatetippingpoints.info
Note that these tipping points can either be caused by natural climate fluctuations or by external forcing, such as global warming. These tipping points, which are likely to occur in the next one to two centuries (or even earlier) with anthropogenic emissions, are likely to lead to an irreversible trajectory. It would then take centuries, if not millennia, to return to the ‘original’ situation.
These tipping points are many and varied: there is of course the Amazon forest, but also the melting of the Arctic ice pack, the partial (Antarctic) or total (Greenland) melting of the ice caps, changes in thermohaline circulation, the transformation of the Amazon forest into a savannah, the weakening of the Indian summer monsoon, the thawing of the permafrost (which would release greenhouse gases), etc. Here is a map that summarises the main theoretical tipping points after a certain degree of global average warming:
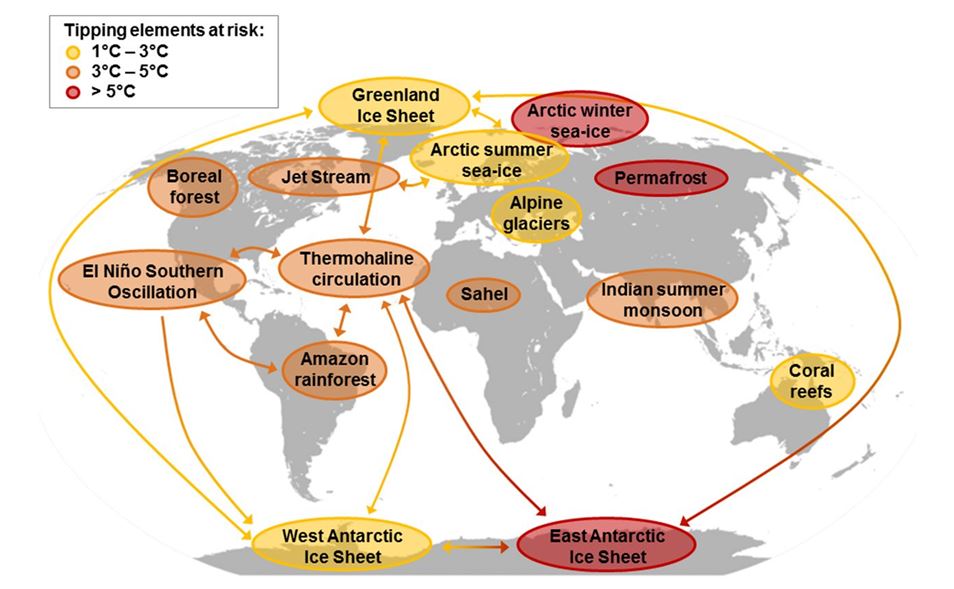
Source : Will Steffen ² al. PNAS 2018
How worried should we be ?
TheGlobal warming does not induce a “linearity” of impacts: the consequences of a warming of +3°C are not simply “double” the consequences of a warming of +1.5°C , they are much more serious, including the risk of positive feedback loops‘, of which the Antarctic instabilities are a part.
It is also very important to understand that these tipping points are difficult to define precisely, and once triggered, do not necessarily lead to an abrupt and immediate change in climate In the case of sea level rise, for example, the consequences can take centuries or even millennia to be felt once the ‘threshold’ is passed.
Have we reached a tipping point in Antarctica?
As with the Amazon tipping point, talking about a tipping point in Antarctica is very complex and cannot be summarised in a simple YES/NO answer. Every scientific paper published on the subject is used to make headlines and sell a lot of papers… But this does not reflect the complexity of the phenomenon and the limits of the studies.
There are several elements to take into account. Let us answer the question in four points.
1/ Clearly defining the “tipping point
The year 2021 has been very rich in scientific publications on Antarctica and the possibility of a tipping point. Both in the latest IPCC report and in more recent publications that have not been taken into account in the synthesis. But it is important to know what we are talking about.
First of all, “which tipping point”. The most cited and discussed tipping point (there are several!) in the scientific literature is the West Antarctica tipping point. This is how it is presented in the latest IPCC report: “the collapse of the West Antarctica ice cap (WAIS) is considered to be one of the tipping points of the global climate. Such an event can be triggered when the floating ice shelves break up and the flow of ice to the ocean intensifies.“
Below is a map that allows you to locate and geographically delimit the tipping point in question:
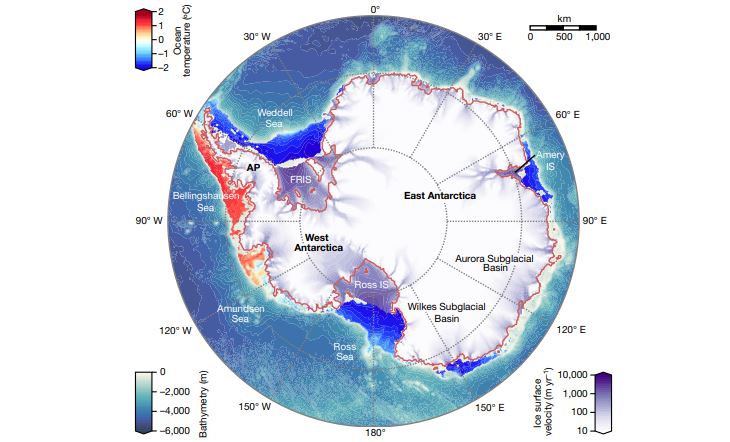
source : The hysteresis of the Antarctic Ice Sheet
Garbe & al. 2020
To be more comprehensive and precise, there are several tipping points in Antarctica. We could talk about a tipping point per basin. In West Antarctica, the most discussed (as the most imminent, i.e. with a chance of being crossed/have been crossed) are
- Tipping point of the peninsula (regions 26 and 27, successive disintegration of the Larsen ice shelves, A, then B, then C), but they do not govern too large an ice mass.
- The Ross Ice Shelf (governing areas 18 and 19 of the Sipple Coast).
- The two tipping points on Pine Island (region 22) and Thwaites (region 21). Distinct tipping points on Thwaites and Pine Island
In East Antarctica there are also some candidates with perhaps slightly higher tipping points (+4°C global, see last figure).
- The Totten Glacier, whose acceleration could trigger instability throughout the Aurora Subglacial Basin (region 13). The GRACE cards are also showing an upturn.
- The Cook, Ninnis and Mertz glaciers which govern Wilkes Subglacial Basin (region 14)
- Glacier Recovery (region 3)
Here is a more precise map with all the identified basins :
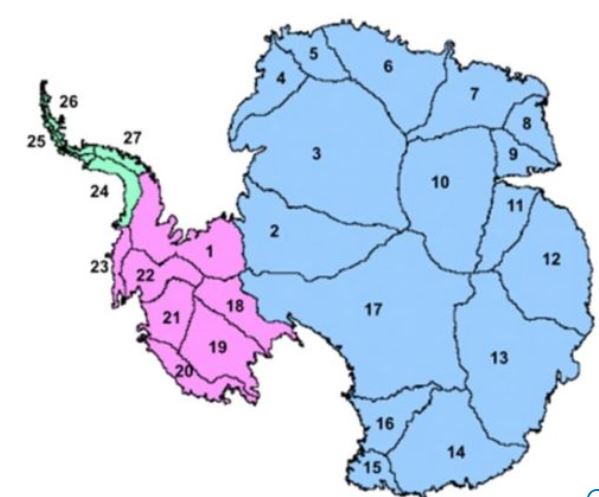
cover areas of respectively 232,950 km², 2,039,525 km² and 9,620,225 km².
Source : Mass balance of the Antarctic Ice Sheet
from 1992 to 2017
2/ What does the IPCC say about the tipping point in Antarctica?
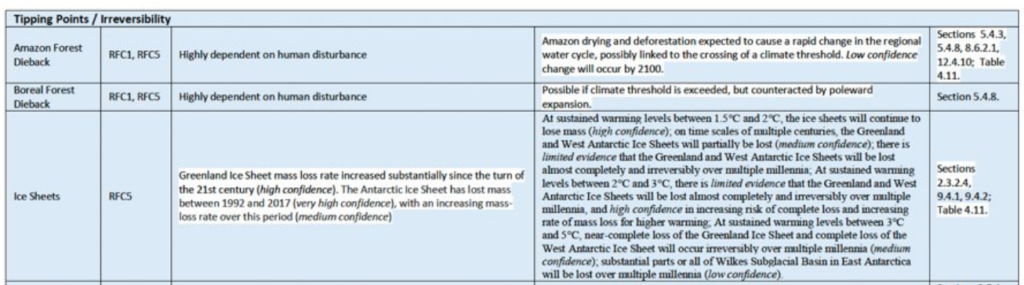
Contrary to what we may sometimes hear, the IPCC has not ignored these climatic phenomena at all, and has in fact documented them very well in the working group 1 of the 6th report. Associated with each tipping point is the level of uncertainty and the level of risk of crossing it.
Thus, the IPCC’s conclusions on a possible tipping point are explicit regarding the West Antarctica ice sheet:
C.3.2 The probability of low-probability, high-impact outcomes increases with global warming levels (high confidence). Abrupt responses and tipping points in the climate system, such as a sharp increase in ice loss from the Antarctic ice sheet and forest dieback, cannot be ruled out (high confidence; Chapter 4, 5 and 12).
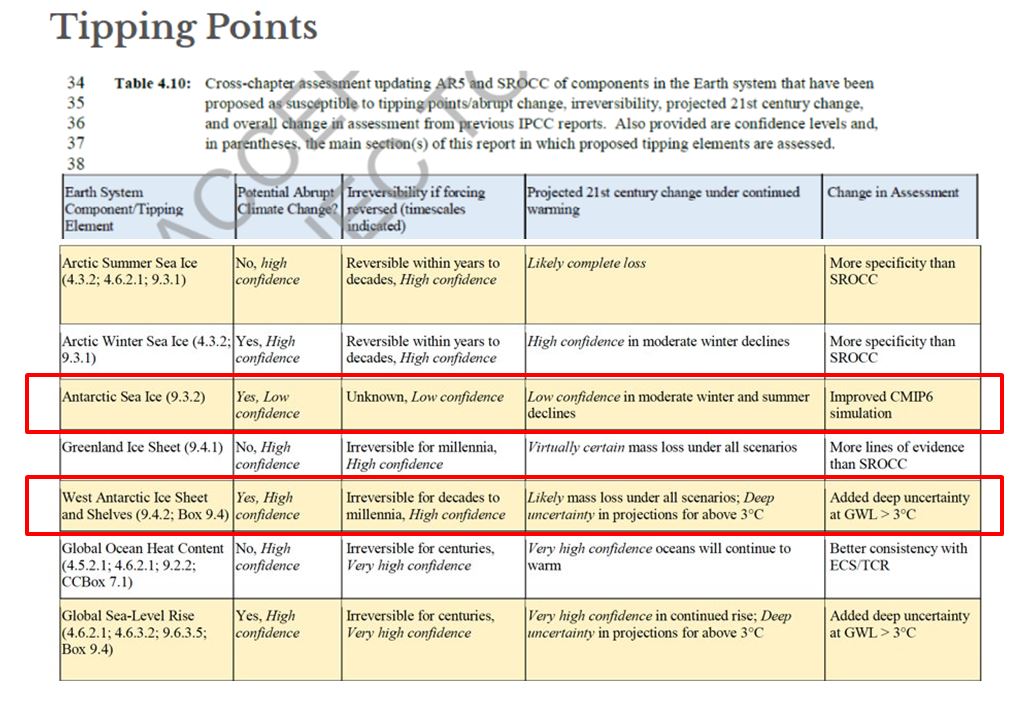
The degree of confidence associated with each “tipping point” can be seen
However, although some studies estimate the potential tipping point to be between 1.5 and 2°C, and many studies estimate the total loss of the West Antarctica ice sheet to be committed to 2 or 3°C (p. 9-78), the AR6 report states in its summary that the evidence for irreversible loss below 3°C is limited
This does not mean that the IPCC rules out the West Antarctica tipping point, but rather that there are simply not enough studies available to be sure that it could happen below 3°C. As we will see in the conclusion of this section, there have been new (worrying) studies since then.
The degree of confidence associated with each “tipping point” can be seen
3/ Criteria and uncertainties around the tipping point
Due to the complexity of ice sheet dynamics, it is difficult to know exactly when a tipping point will be reached. In this study by Pattyn & al. the authors think “it is plausible that we have already passed a tipping point”.
The Pine Island Glacier is a large, fast-flowing river of ice that drains an area of West Antarctica two-thirds the size of the UK.
It is currently the fastest collapsing glacier in Antarctica and accounts for a quarter of all the ice lost in the region. Satellite measurements have shown that the Isle of Pines glacier basin contributes more water to the sea than any other basin in the world, and this situation is worsening due to the recent acceleration in ice flow.
In March 2021, a study by Rosier & al. identified three tipping points, including the Pine Island glacier. This report could not be included in the IPCC conclusions, but again, the news is not very good:
A tipping point may have already been triggered in the Amundsen Sea region, where the Pine Island and Thwaites glaciers dominate current Antarctic mass loss, but modelling and observational techniques have not been able to establish this rigorously, leading to differing views on future West Antarctic ice sheet mass loss.
This is consistent with the findings of the Lenton & al. paper in 2019 which highlighted the same 3 tipping points, again saying that one of the tipping points had already been crossed.
Certainties and uncertainties
Based on the above studies, we can conclude that :
- We are almost certain to pass a tipping point. It is no longer a question of whether or not it will happen, but when.
- The results obtained are not linear: it depends on the climate and cap models used, the model calibration, the friction law, etc. Moreover, we only have 40 years of satellite observations. The more time passes, the more we will know if there is an acceleration of this mass loss.
- Without meeting the Paris Agreement commitment (below 2 degrees), we are certain to reach a tipping point. Even with respect to our commitments, we cannot eliminate the risk of crossing a tipping point.
4/ At what degree of global warming would there be a tipping point?
In 2016, three researchers explained that in their view “the right climate targets were chosen in Paris” (when the the Paris Agreement, to keep average temperature “well below 2°C” and “continue action” to “limit it to 1.5°C above pre-industrial levels”).
In support of this, they showed in the figure below that these targets (“Paris range”, in grey) make it possible to avoid as much as possible triggering potentially disastrous tipping points (the colour from yellow to red indicating the level of risk of “tipping”).
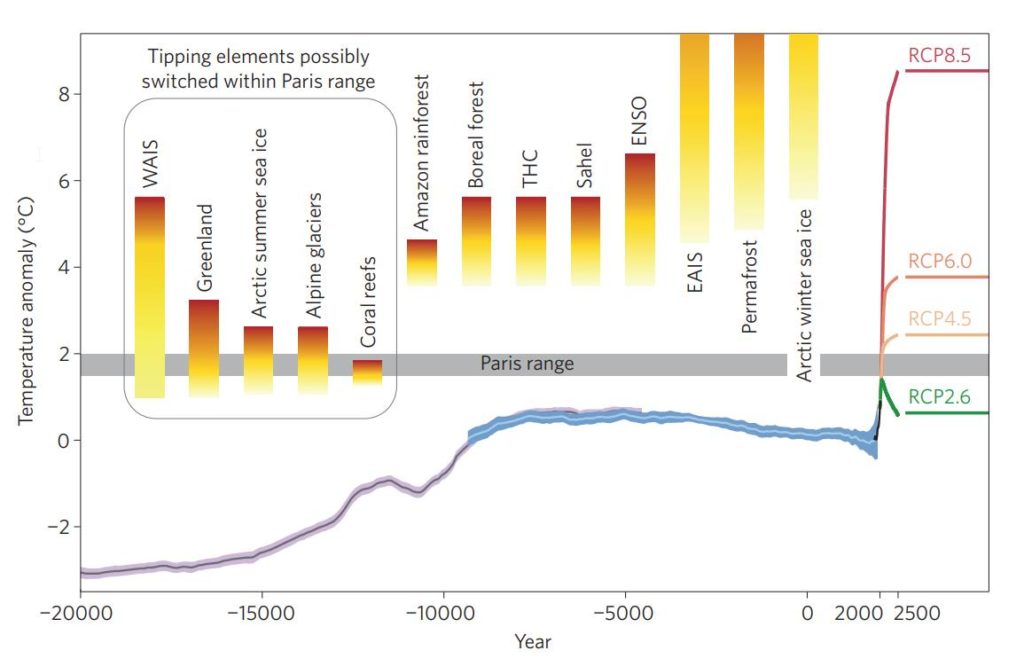
There is consensus, however, that irreversible loss is expected beyond 3°C, adding more than 3m to sea level rise over the next 2000 years. The East Antarctica sub-glacial basins (including the Wilkes and Aurora sub-glacial basins) experience some loss below 3°C, and probably collapse between +3°C and +5°C.
The last word
Defining and estimating a tipping point in Antarctica is both complex and complicated. Here are the main points to remember:
- Antarctica is the driest, coldest and windiest continent in the world. The average temperature is -20°C during the southern summer, and about -60°C the rest of the year.
- To fully understand the links between climate and glaciers, it is necessary to measure and analyse the surface mass balance of the entire glacier on decadal scales to analyse robust trends.
- The extent of the Antarctic ice pack is rather stable. There has been no significant trend in Antarctic sea ice area between 1979 and 2020 due to opposing regional trends and high internal variability.
- In contrast, the ice sheet, which covers most of Antarctica, has shown a strong trend of mass loss since the late 1990s. This trend accelerated around 2005, and currently Antarctica is losing about 175-225 Gt per year.
- Quel que soit le scénario climatique envisagé, l’évolution du glacier dans les prochaines décennies est en partie déjà établie en raison de l’inertie du système climatique et du temps de réaction très lent des glaciers au changement climatique. Its ice loss will therefore continue irreversibly until the middle of the 21st century.
- The contribution of the polar ice caps to sea level rise over the next few decades, particularly due to a possible runaway collapse in the unstable West Antarctic region, is generally regarded as the greatest source of uncertainty in sea level rise projections.
- Thereare several tipping points in Antarctica. We could talk about a tipping point per basin. The tipping points in West Antarctica are the most discussed (as they are the most imminent).
- We are almost certain to pass a tipping point. It is no longer a question of whether or not it will happen, but when.


