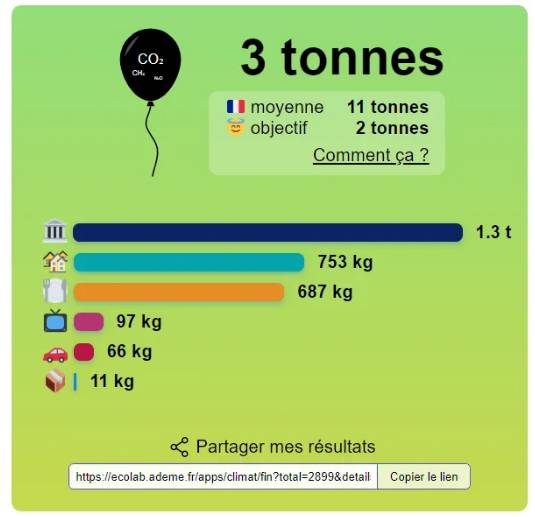
Thousands of you simulated your carbon footprint and almost as many panicked when comparing the target (less than 2 tons CO2eq/year) and the share of the utility’s carbon footprint. These famous 1.3t which are displayed and which leave very little room before exceeding the famous 2 tons…
Sommaire
What do public services represent?
Public services include the services of the State, its public institutions and its operators. The 2.4 million French people who work there have a vocation to play a driving role in the ecological transition: how could citizens accept to change their habits if the State and its employees do not show the example?
We interact daily with the state services. Here is a non-exhaustive list of things we can enjoy thanks to public services, like the passport for the w-e in Bali or the criminal record for Patrick Balkany :

Public services represent a huge state machine comprising a total of 16 ministries, where each ministry is required to report annually as part of departmental exemplary administration plans (EAP). Here is the list of departments, each with a link to the most recent review:
3 key points to keep in mind
It is a titanic task to analyze everything (10 pages for Overseas, 204 for culture…), but here are some key points:
- There are departmental indicators that not only allow us to see the progress made by each department from year to year, but also to facilitate a cross-sectional reading of the documents.
- Some departments are much more transparent and up-to-date than others. Some have recent (2018) numbers when other departments, like the Army, only have numbers from 2015.
- The details of the programs are sometimes not very clear and the details of scopes 1, 2 and 3 are very bad. I had the impression of reading the balance sheet of the CAC40 companies… It is however essential to pilot with efficiency the transition in order to reach the objective number 1: carbon neutrality.
How utility emissions are distributed
When you simulate your carbon footprint on NosGestesClimat, you get a figure of 1.3t CO2eq. What does this number mean? It is simply the total footprint of public services in France, divided by the number of inhabitants. Two good news:
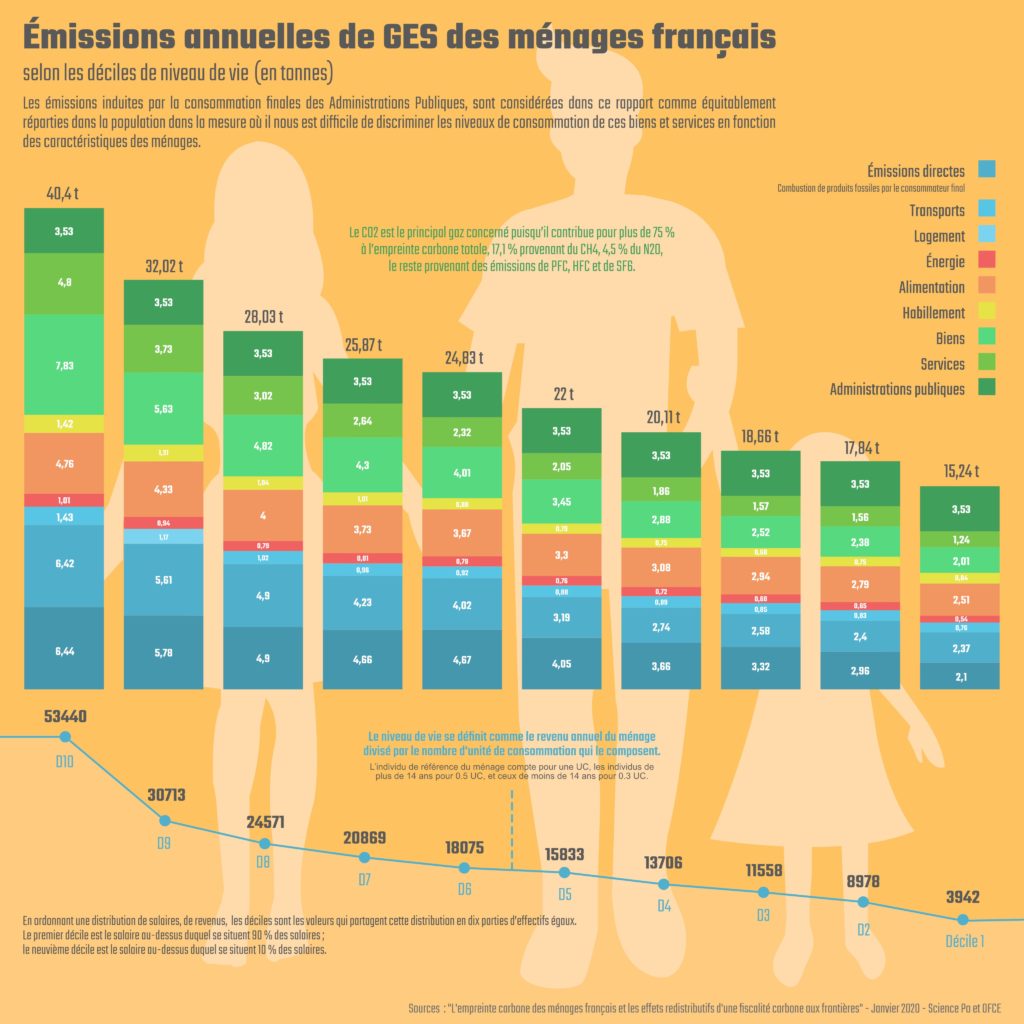
- First, and this is the only time it is possible, all French people have the same carbon footprint for the item ‘public services’! Indeed, whether you are a student or a pensioner, a billionaire or a blogger in your neighbor’s basement, it is the same thing! We had seen in an infographic that emissions tended to increase with your income. On the other hand, as you can see below, whether your household is among the least or most affluent in France, the weight of public services is the same: Translated with www.DeepL.com/Translator (free version)
- Second good news, Utilities will also have to be carbon neutral by 2050 and therefore no longer a ‘weight’ in your carbon footprint ! This means that you will be able to remove the 1.3t CO2eq from your footprint in 2050, hoping that the State, its public establishments and its operators will do what is necessary to reach carbon neutrality.
To achieve this neutrality, this means that each ministry, each operator and each agency will have to initiate an ecological and environmental transformation agenda that will permeate all of their businesses and activities, giving new impetus to the modernization of the public sector. We will see below the 6 themes on which the departments will have to work.

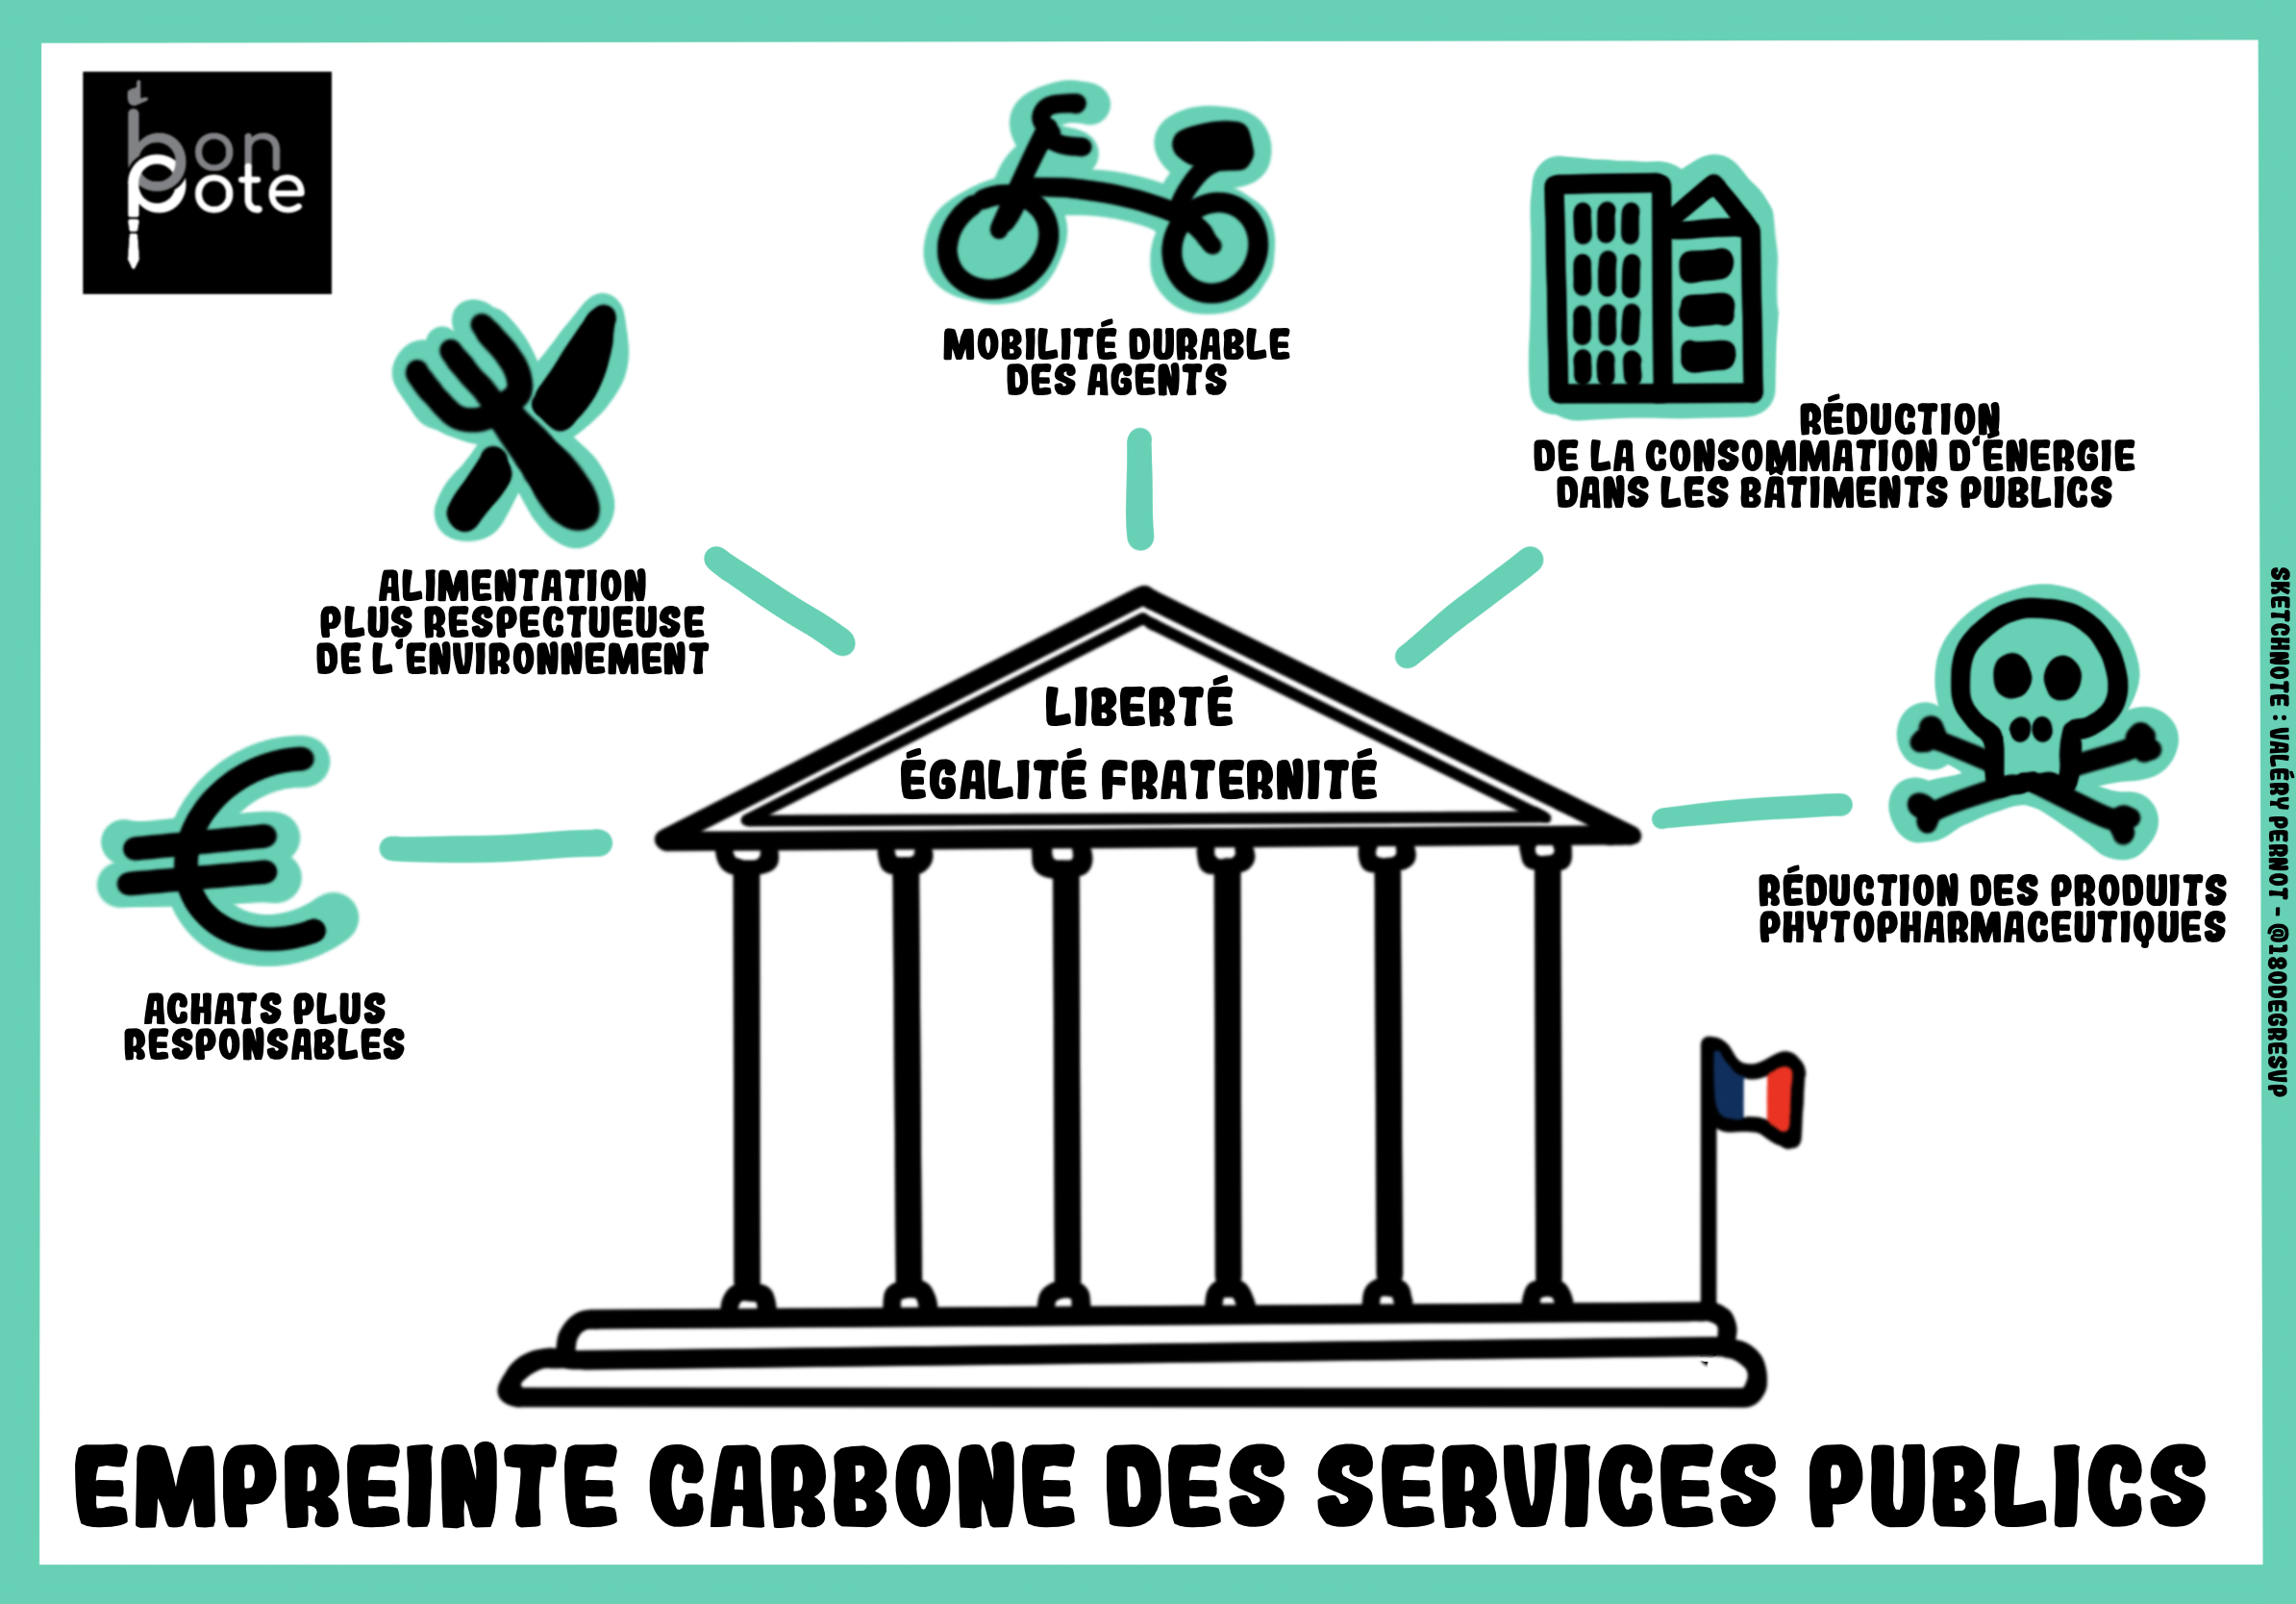
What is the state doing to lower this carbon footprint?
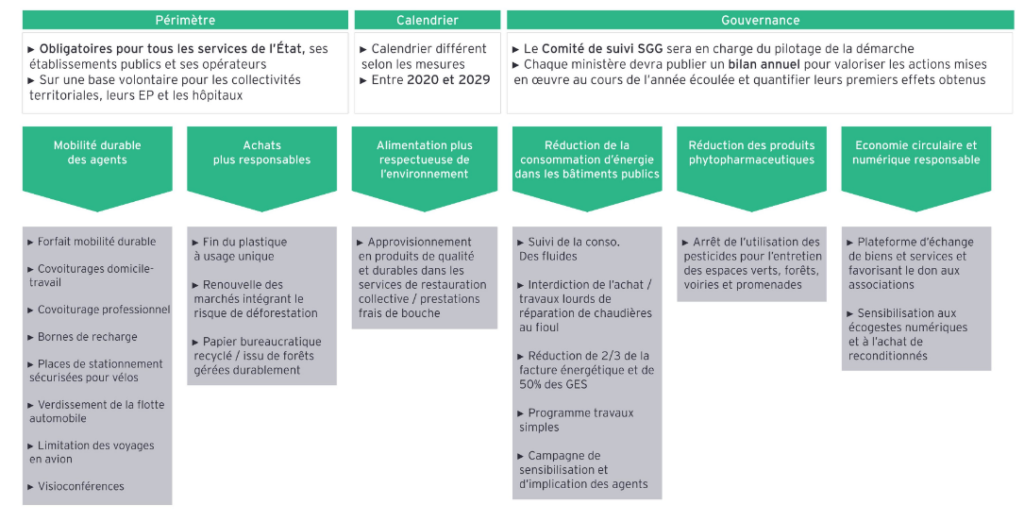
In the same way as the private sector, the State must help public services to reform so that they can become carbon neutral as quickly as possible. By launching the Eco-responsible Public Services plan, the 4th Ecological Defense Council, which was held on February 12, 2020, aimed to accelerate the ecological transition of public services in their operations and missions. You will find below an infographic regrouping the 20 measures, grouped in 6 themes:
By analyzing the different assessments of the 16 ministries, we note without surprise that the two largest emissions items are transportation and buildings, followed by waste and food. Emissions are very heterogeneous between ministries: for example, for the Ministry of the Army, fuel is an important part of the carbon footprint, while for the Ministry of Education, it is the building that is more important.
Also, each department will have its own priorities in its carbon neutrality objective and will have to focus its efforts accordingly. Here is a hummingbird guide of actions proposed to the 2.4 million public agents of the State mobilized for the ecological transition. Read it and you’ll see right away that we’re on the right track.
Why is there a difference in the different simulators?
As we go through the set of simulators available, we can see that the carbon footprint of public services differs among the simulators. Indeed, here are 4 different results:
- Government: 1.1 t CO2 eq for health, education and other public services
- The Ademe simulator: 1.3 t CO2 eq, figure from a 2010 Carbone 4 study… and updated to 1.1 t CO2 eq to align with the government (attention the explanation is not updated)
- MYCO2, Carbon 4 simulator: 1.7t CO2 eq
- Regis Janvier : 1.5 CO2 t eq, updated by sector according to 2010 data from Carbone 4 and the website statistiques.developpement-durable.gouv.fr
First of all, and this is a reflex to have systematically when you look at the carbon footprint data: look at the date. The data changes from year to year, and unfortunately the numbers are not necessarily degrowth. Then it’s about the carbon footprint… And the carbon footprint is much more difficult to calculate than the national inventory! The final figure depends above all on a methodological choice.
France’s carbon footprint is an indicator calculated by the Service des données et études statistiques(SDES). The calculation of a country’s carbon footprint is not governed by international or national standards or rules (this point is very important and yet very often omitted). Il existe différentes approches méthodologiques. Macroeconomic modeling (input-output calculation) is the methodology preferred by the SDES.
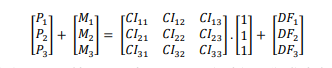
Of course, at first glance, we think it’s simple:

P for domestic production
M for imports
IC for intermediate consumption
DF for final demand
Then we keep digging…
Then

My advice: Either you trust the department whose job it is and stick to the orders of magnitude…
Either you take several months of your time to analyze the data of each department to the decimal point, and you think to send me the result by email… Feel free, I have a good feeling that the Army’s carbon footprint data will be very easy to find!
The last word
With 16 ministries and 2.4 million employees, the public services will have the difficult task of reforming themselves to achieve carbon neutrality. Uniquely, their carbon footprint is shared by all French people equally, since the total footprint of public services in France is simply divided by the number of inhabitants.
Whether this carbon footprint is 1.1 or 1.7 T CO2eq, it should tend towards 0 and should not be a burden on your personal carbon footprint. Given the complexity of calculating the carbon footprint, I emphasize the importance of retaining only the order of magnitude rather than retaining a figure to the decimal point. Besides, would a society where we could calculate everything to the decimal point be desirable?
In conclusion, I would like to invite you to think about the public services of tomorrow. We can say without hesitation that current public services are imperfect and at least unsustainable. The management of Health for years in France is a very good example, 2020 being only a perfect illustration of everything that is wrong with the current economic system.
Without systemic change, we will continue to put pressure on our health care system, making it almost impossible for it to be economically and environmentally sustainable. If we continue to do so, we will increase the chances of further pandemics (source: IPBES). I don’t know about you, but staying cooped up all year long doesn’t really interest me.
The reflection does not stop at the health but to all departments: everyone will have to make an effort. The State will have to be the engine of this change and all its employees will have to show the example. This concerns also the Army, Education, Research… In other words: for your 1h30 conference in New-York… Zoom will do fine.