More and more people are asking what the carbon footprint of a flight is, and that’s good. The problem is that there are several calculators, more or less old, and that very often take very few criteria into account and sometimes forget essential data.
So here is a new free and open source flight carbon footprint calculator. You will be able to know the impact of your round trip for your trip, and know in a few clicks if going to NY, Dubai or Bali “just once a year” is compatible with the respect of the Paris Agreement.
Of course, if you are wondering what a carbon footprint is and why you should know yours, I invite you to read this dedicated article. Same thing if you don’t know the consequences of air traffic on climate change.
Sommaire
The carbon footprint simulator of a flight
Let’s find out the carbon footprint of your flight!
What criteria should be considered for a flight?
Here are the criteria taken into account for your flight:
- Distance: the longer a flight is, the more greenhouse gases it emits and contributes to global warming. Nothing surprising so far. On the other hand, a short flight will have a slightly higher impact per kilometer flown, in particular because of the take-off and landing phases which are highly emitting.
- Comfort: 1st or 2nd class: the carbon footprint of a flight is divided by the number of passengers, and in particular by the seat you take in the flight. Therefore, a first class flight that offers more space (and therefore more comfort) will be more expensive than a second class flight.
- Radiative forcing coefficient: with the exception of the DGAC (Direction Générale de l’Aviation Civile) website which does not take into account the contrails and cirrus clouds that form after the passage of a flight, all simulators take them into account. Remember that this doubles or triples the impact of radiative forcing. Everything is explained here.

What are the limits of the calculator?
The purpose of this calculator is to have an order of magnitude. It is difficult to have a perfect result to the decimal point, especially because of these limitations:
- Not all flights are the same, and some are more efficient in terms of emissions per passenger kilometer.
- Number of seats: the number of seats and therefore of passengers varies according to the flight, it is not taken into account.
- Connection(s): the number of connections is not indicated (see the first remark on the emissions of a take-off + landing). Some long-haul flights are almost systematically made, with very rare exceptions, with a stopover (for example, a Paris-Sydney).
- Choice to attribute cargo in passenger emissions: some flights also have cargo, and the emissions will be attributed to the passenger. More details on the calculation here.
NB: the simulator is open source, the data are public in order to benefit from the different feedbacks and to improve the simulator. Leave a comment or contact Maël Thomas directly.
Should contrails be included?
The biggest difference between the simulators you will find is often explained by the fact that contrails are not taken into account. The big game of airlines and the Direction générale de l’aviation civile (DGAC) is to take into account only CO2 … while they have a positive effect on radiative forcing (and therefore a warming effect), and not just a little!
It is quite correct to say that CO2 and contrails should not be equated. The contrails are supposed to be short-lived, temporary… but this is not the case, given the sustained and increasing air traffic for several decades.
Moreover, we are talking about the impact of aviation. Why is it very important to take into account the most recent data? Because 10 years ago, the simulators of the time only took CO2 into account. Except that research has progressed, and today we know that non-CO2 effects account for between 1/2 and 2/3 of radiative forcing.
The IPCC has identified them in its graph of radiative forcing over the period 2010-2019, far right:
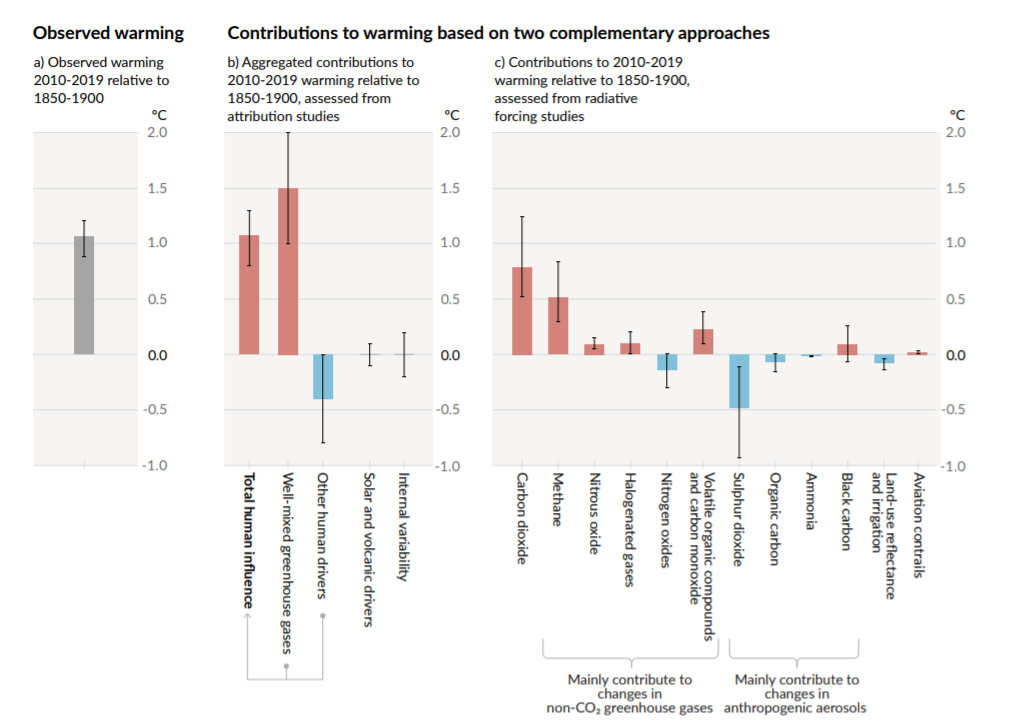
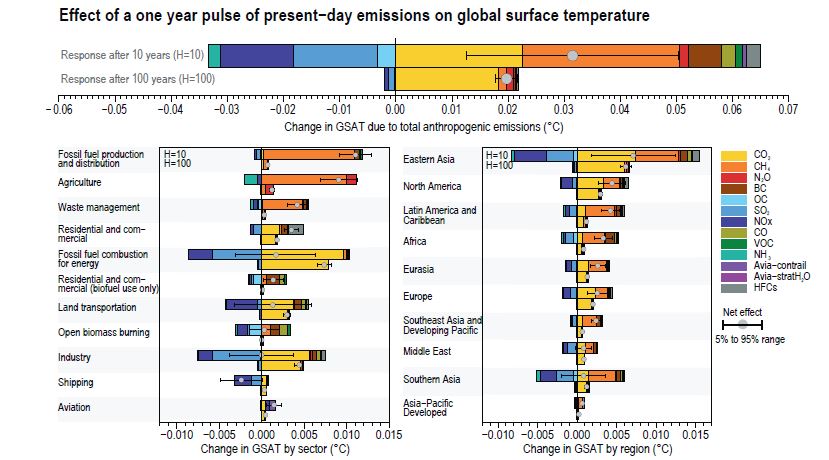
More details are available in Chapter 6 of the new IPCC report. You will find in particular figure 6.16, which represents the response of the global average temperature 10 and 100 years after a year of current emissions, but also all the evolution of the research since the 5th IPCC report.
We thus understand that research has greatly evolved in barely 10 years concerning the impact of air on global warming, and that it is necessary to continue to answer the uncertainties.
Carbon footprint calculator: the final word
Everyone should know the impact of their flight travel and be able to understand that impact. This is the objective of this calculator. The results displayed, which are intended to be informative, should enable everyone to make responsible decisions, particularly when an alternative to flying is possible.
Every ton contributes to global warming. Every ton matters.