
So that they don’t get lost in the meanders of social media, you can now find all the Bon Pote infographics in this article!
They are very good complements to the articles and have many advantages:
- A quick read of the news: the essentials presented in a few ideas or figures
- They can be shared more easily, especially on social media.
- They can be printed (at the office, at home, etc.)
Some points to remember:
- When they are published on social networks, infographics are always accompanied by an explanatory text that allows (as far as possible) to give additional information that may not appear on the infographic
- An infographic, by essence synthetic, will never replace the content of an article (which itself is a synthesis of a subject, with several scientific articles or books as sources).
- Always take the figures with care! Look carefully at the date, the source, the frame, the limits… You can make the numbers say whatever you want 😉
These infographics will also be available in the ‘Visuals’ drop-down menu on the Bon Pote homepage. If you want the ideas to spread, share these infographics!
NB: PLEASE CREDIT THE WORK WHEN USING THESE INFOGRAPHICS. If you enjoyed it and found it useful, you can support the work via Tipeee.
Sommaire
The infographics
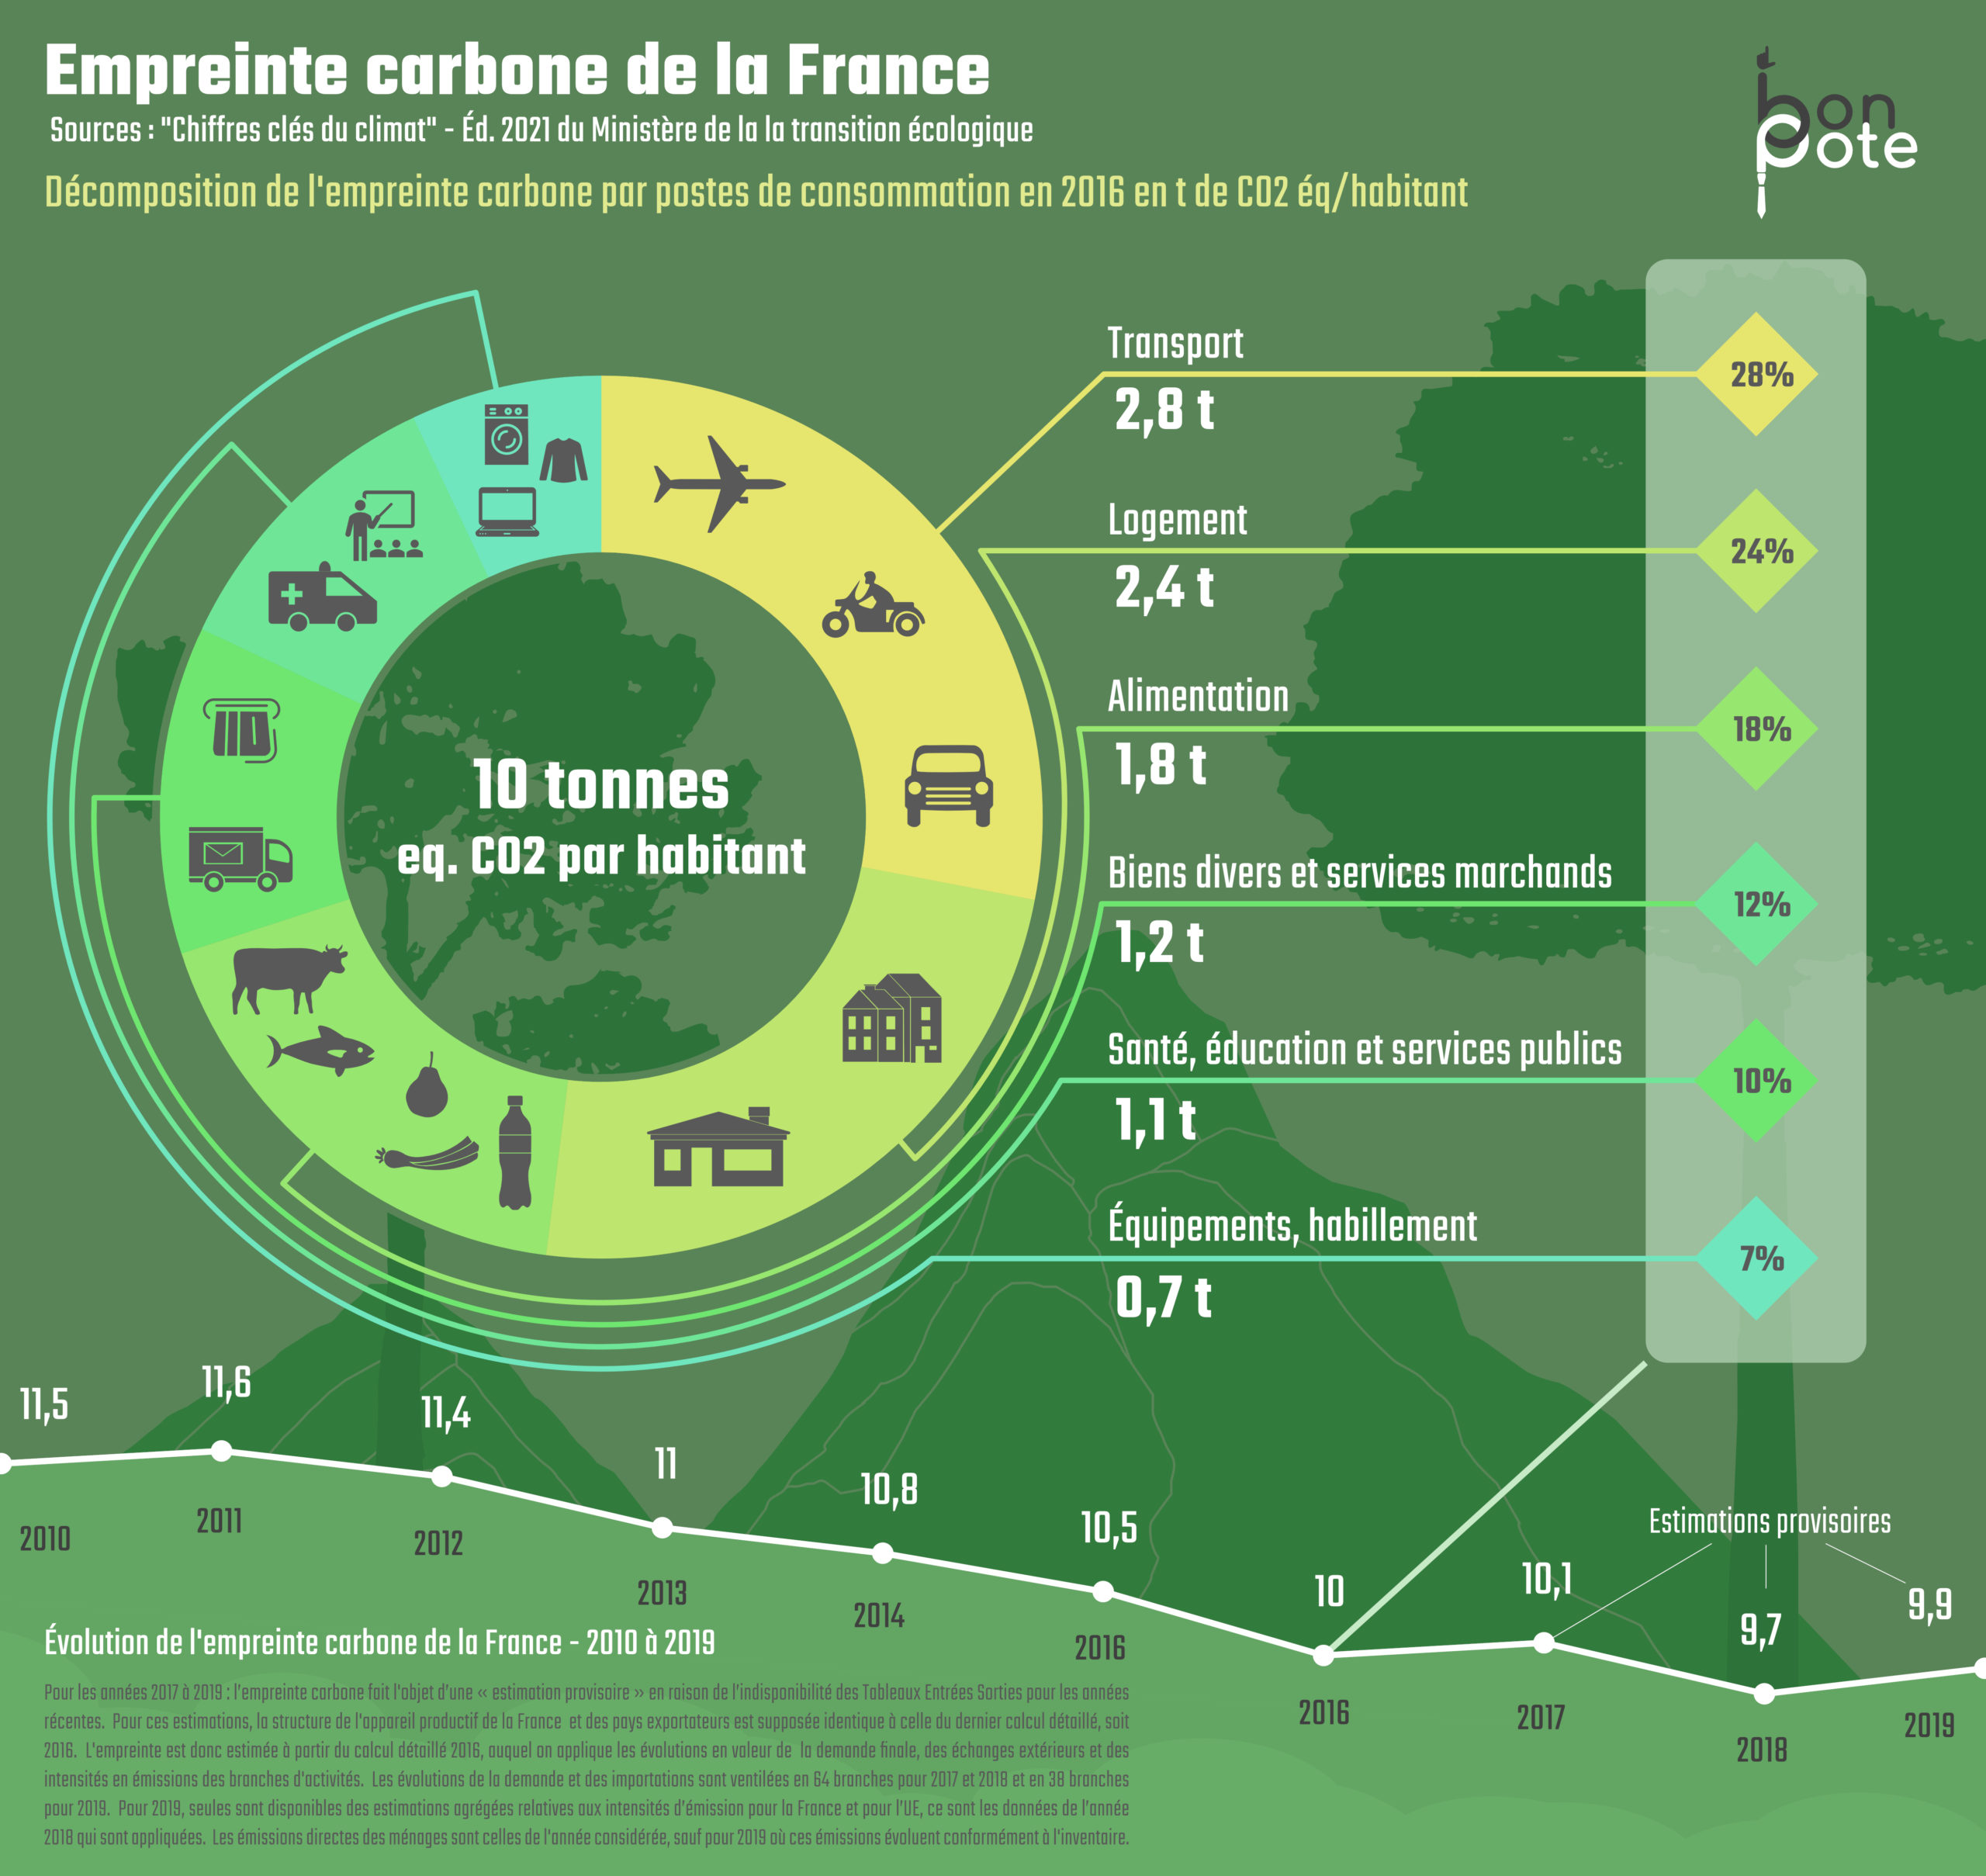
France’s carbon footprint
3 tons of carbon footprint by 2030?

GHG emissions of French households by decile

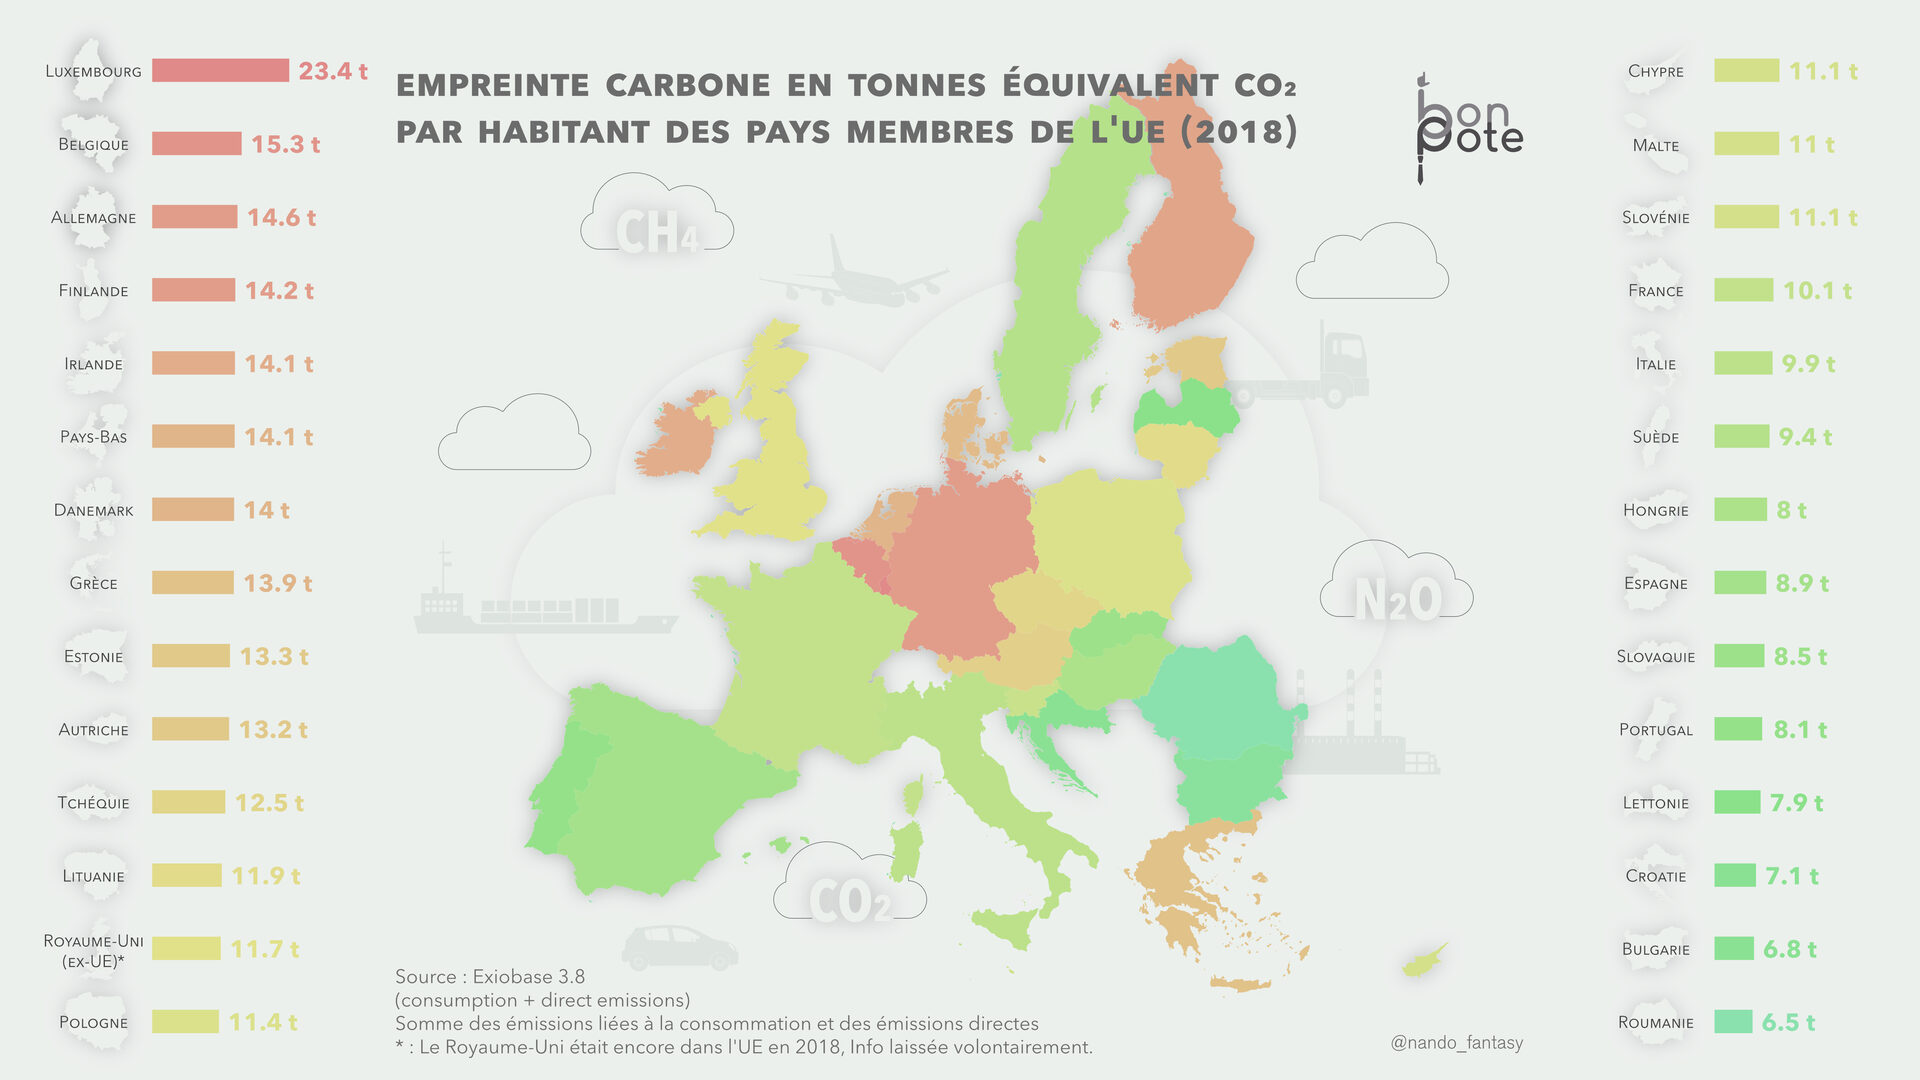
Carbon footprint of European countries

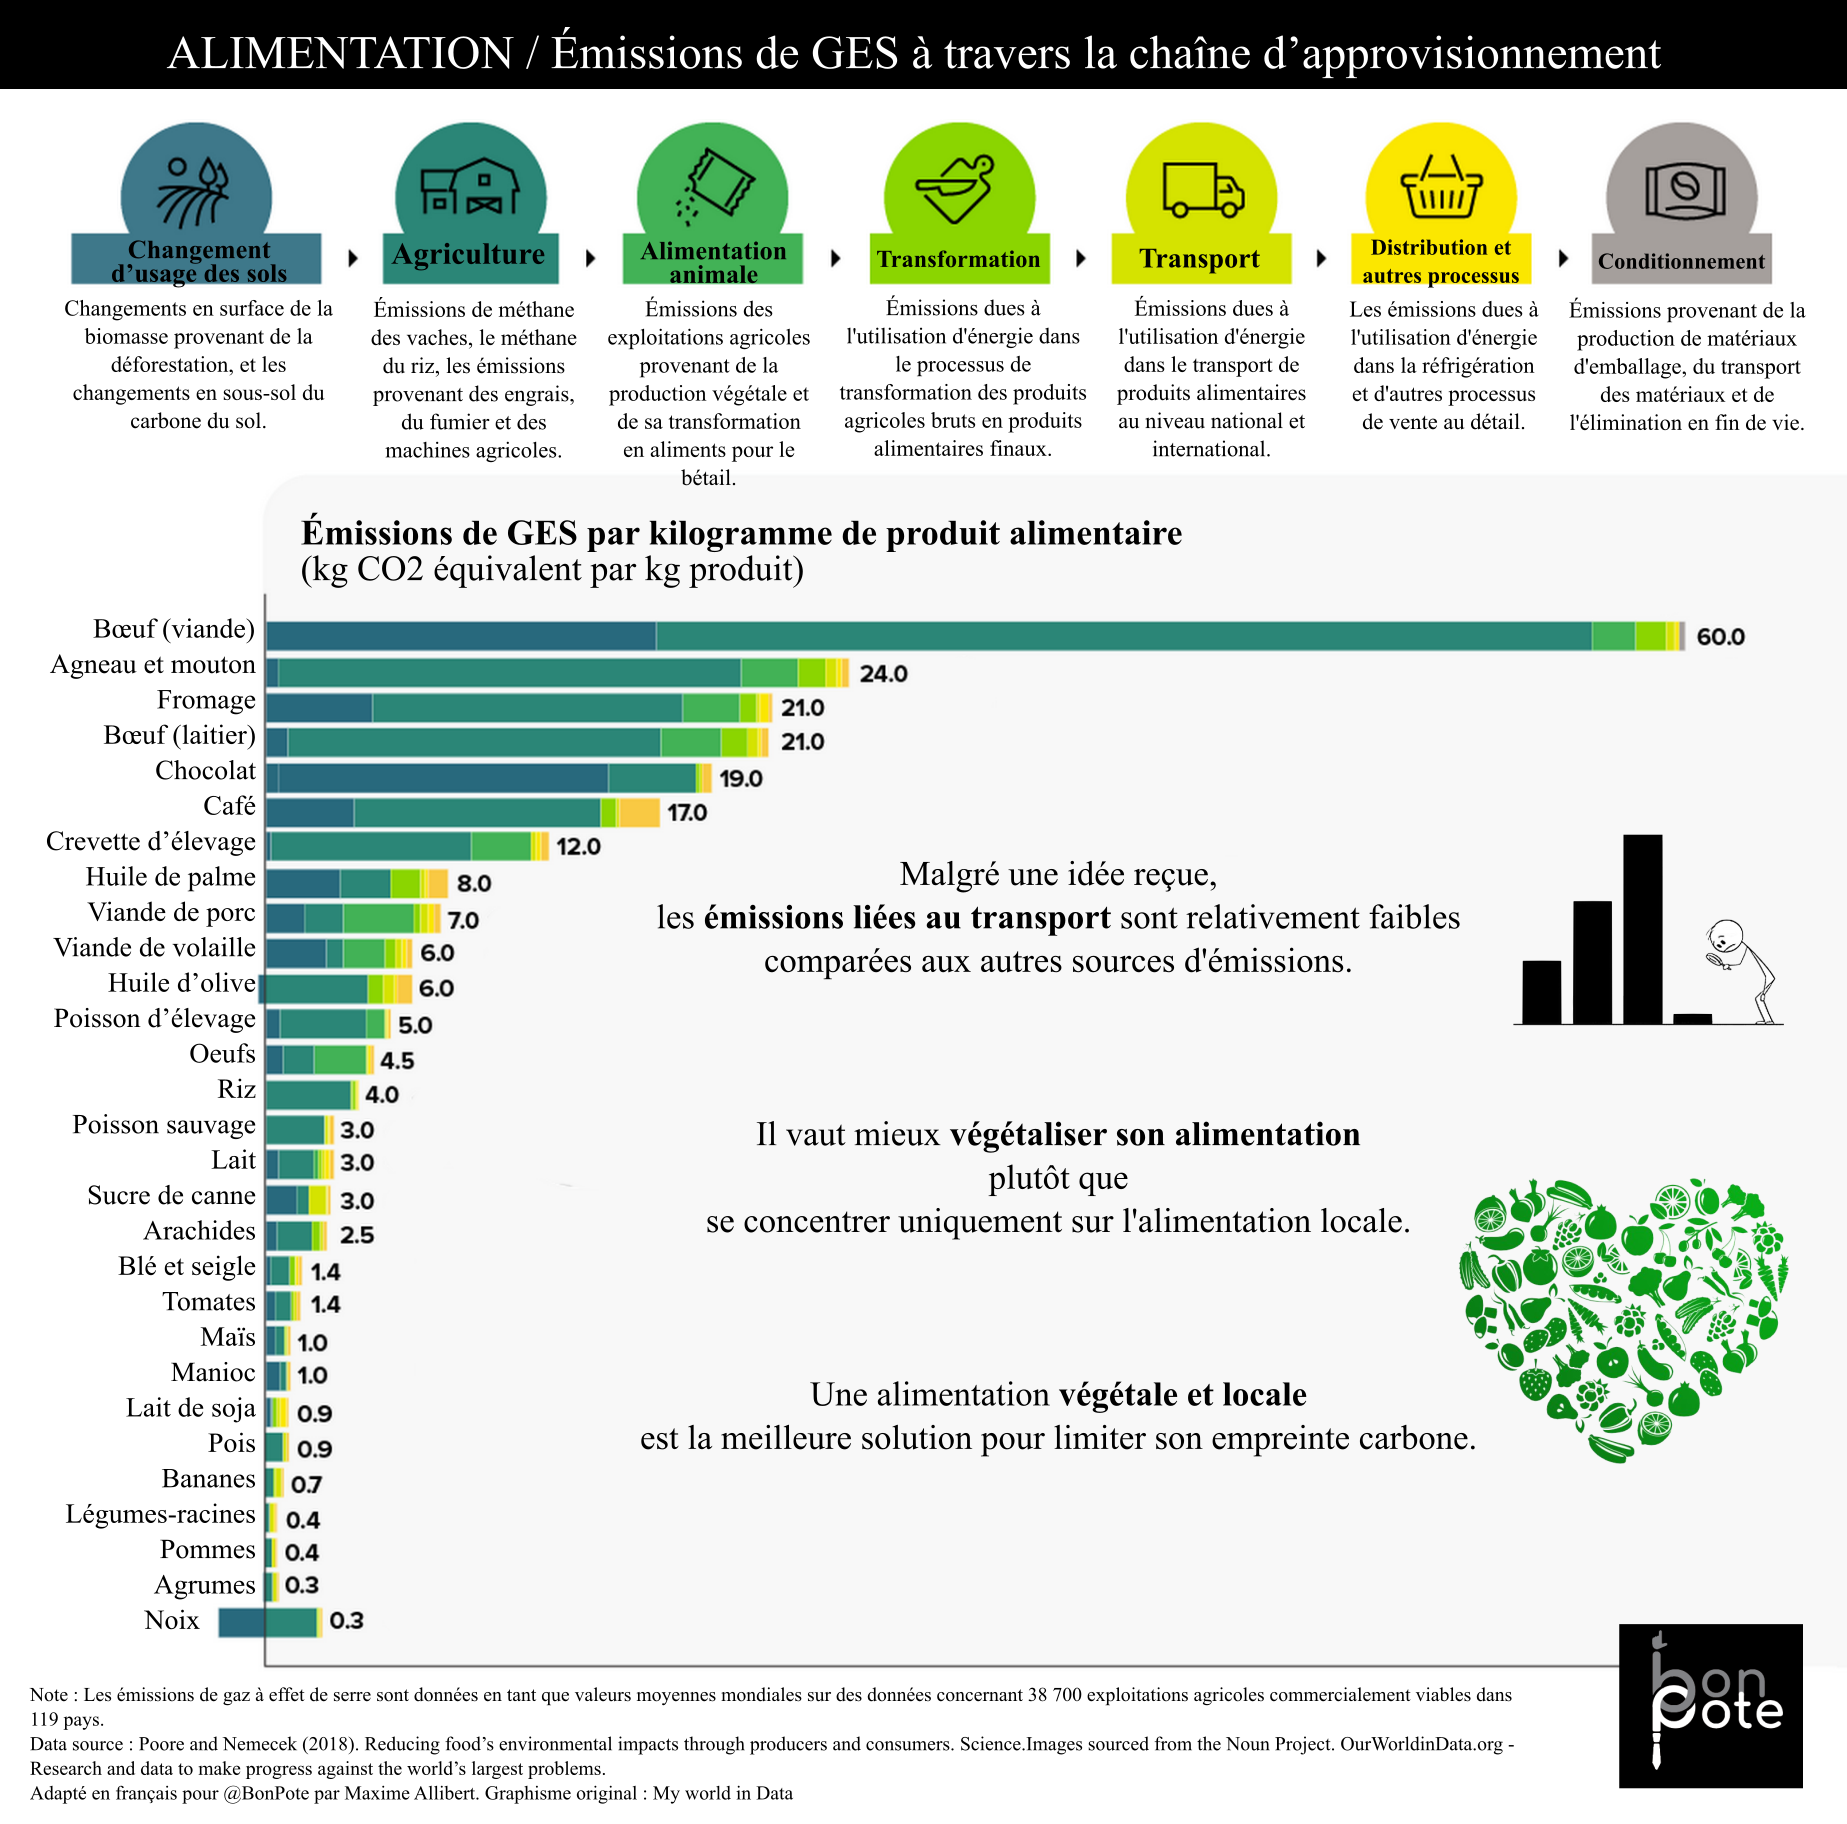
Take care of your diet!
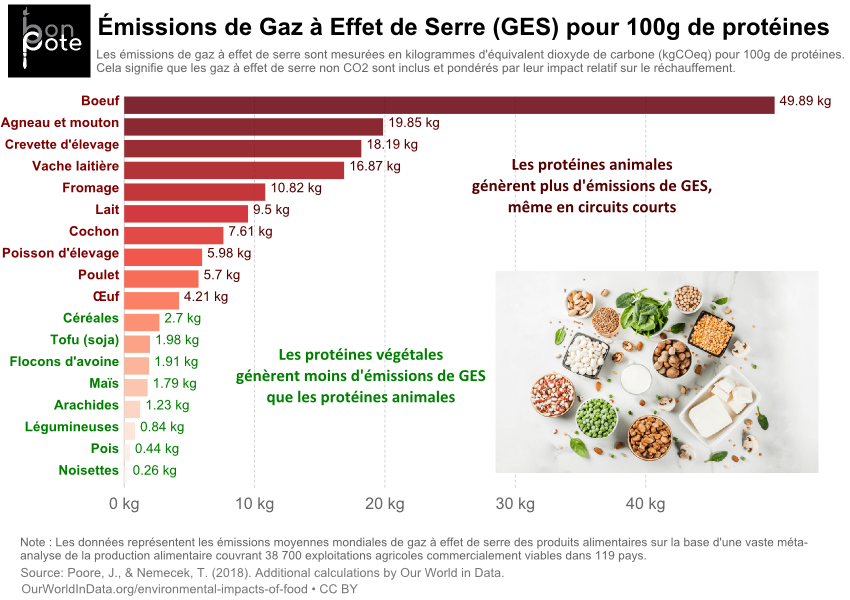
And the same thing, but in protein?
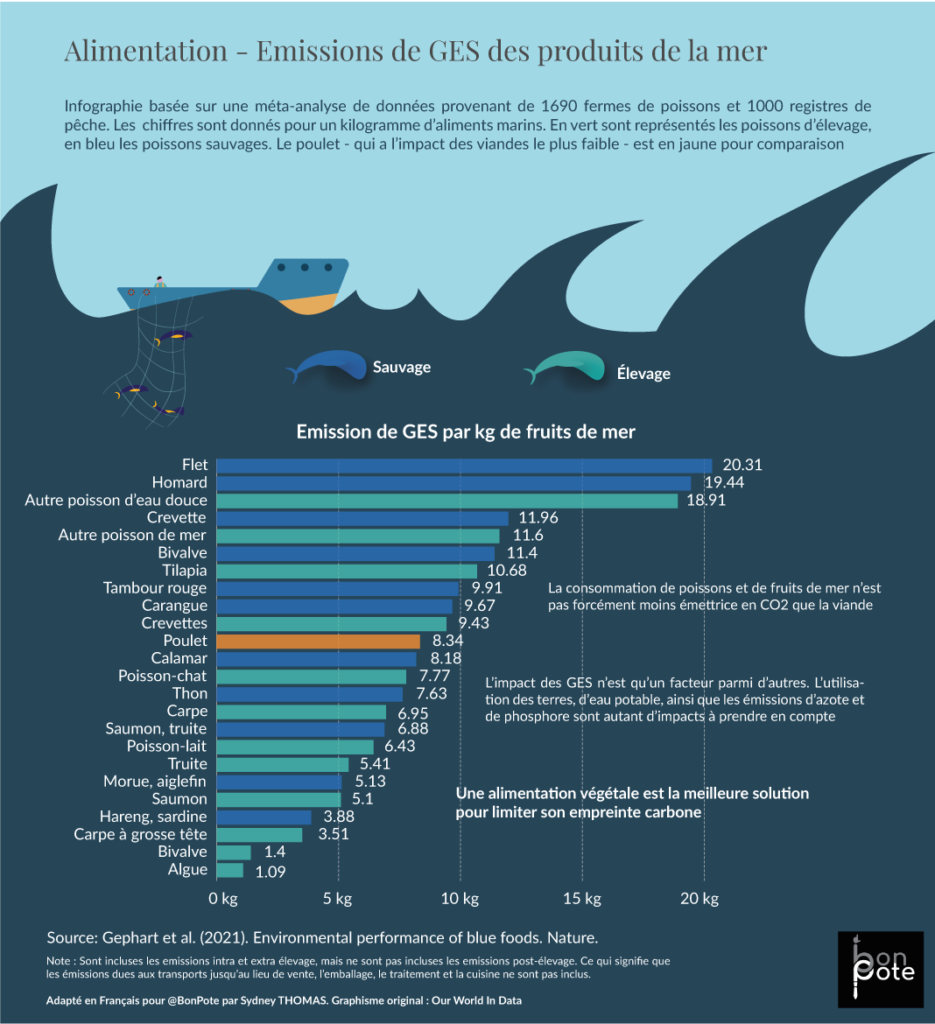
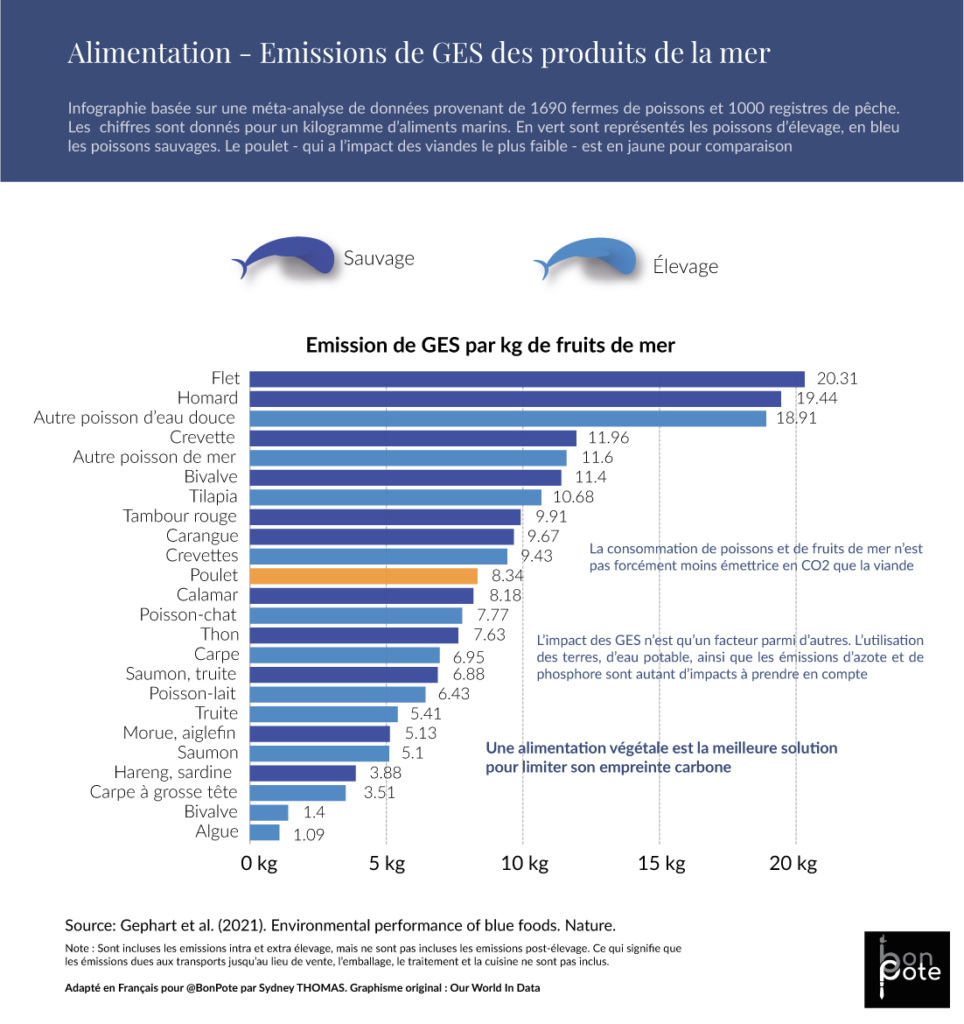
And the fish?
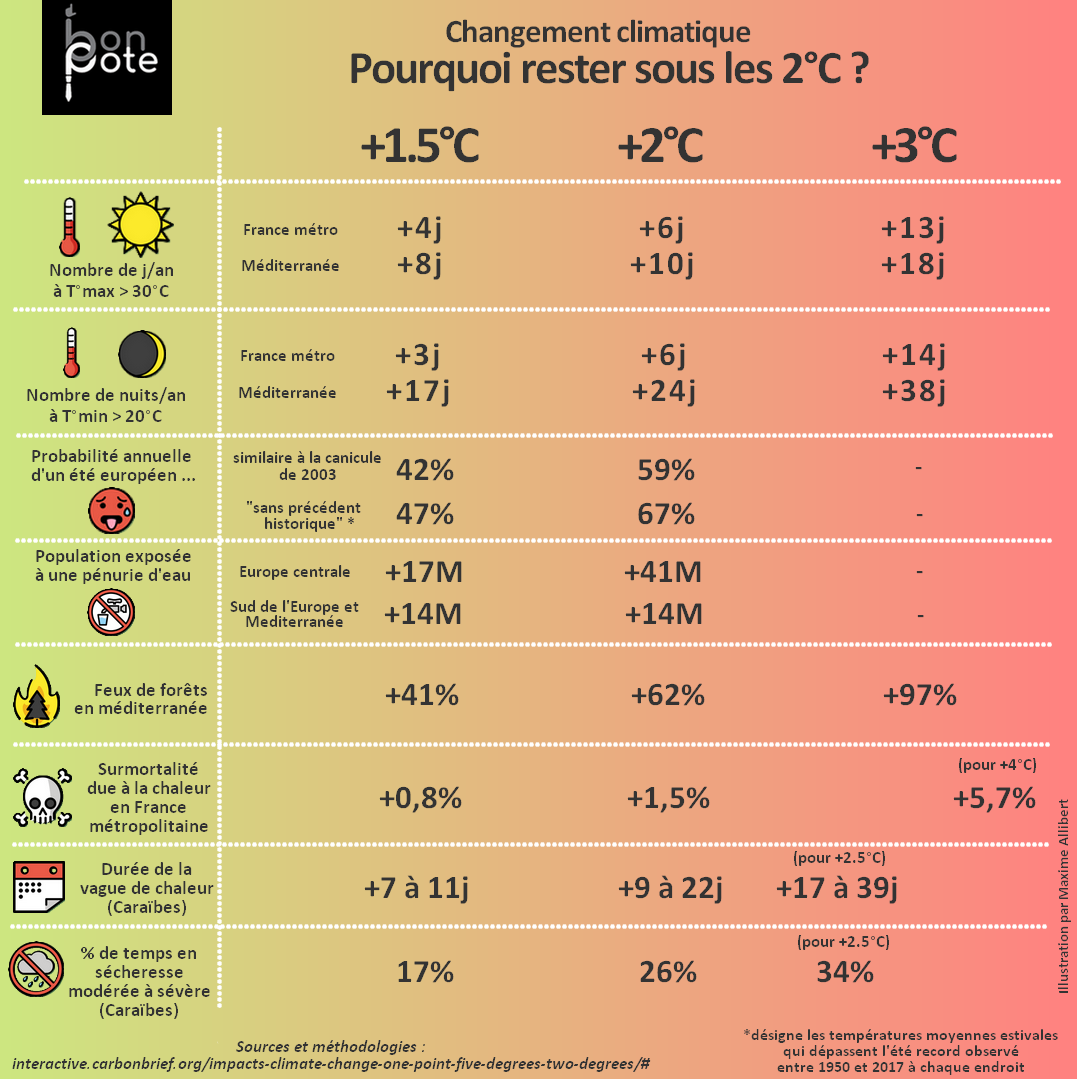
Difference between +1.5 or +2°C warming
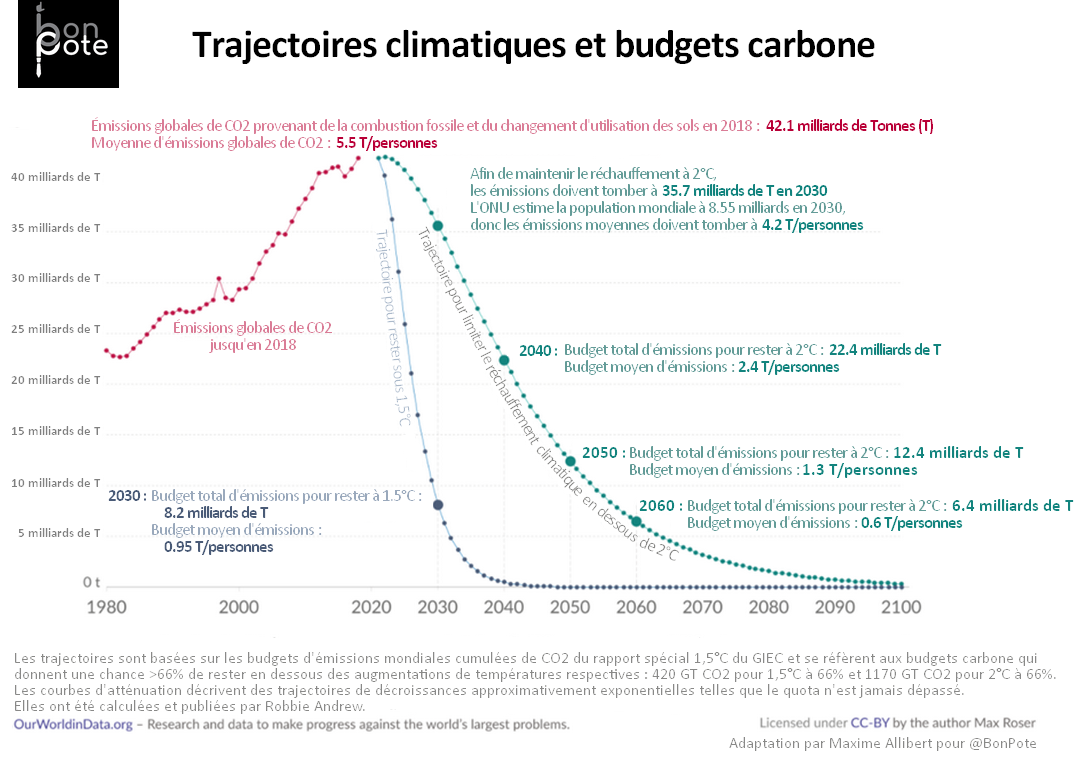
Climate trajectories and target carbon budgets
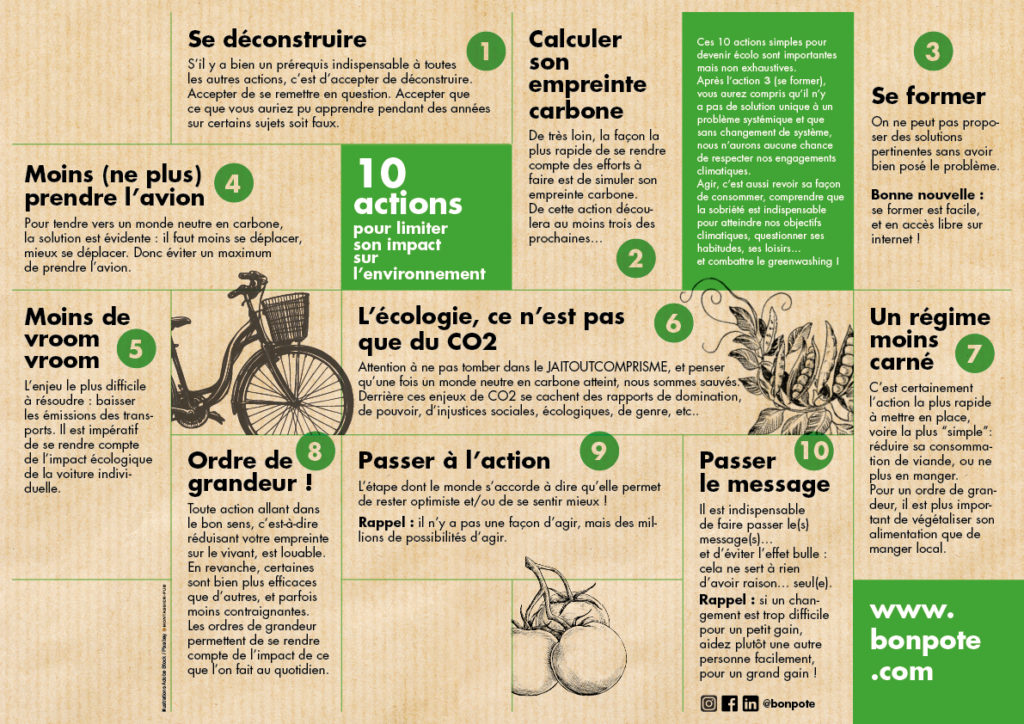
10 actions to limit your impact on the environment
To complete these infographics:
- The 4 infographics on agriculture. It is the most complete work of popularization that I could see on agriculture to give keys of reading to those who are interested in the subject.
- The orders of magnitude, whether in articles or on social networks with the #orderofmagnitude. Some orders of magnitude are infographics, both are useful and included in some presentations!
- The numbers shared daily on social media (Twitter, Linkedin, Facebook and Instagram). The content is not necessarily the same on all!