A few months ago, I asked Guillaume Martin (mobility consultant at BL évolution) if he was motivated to write a few lines about cycling to be published on Bon Pote. He came back to me with almost 60 pages of content, well-argued, illustrated, and sourced!
To facilitate the reading, we publish this file in 5 parts, which can be read in a row or independently of each other:
- Part 1: Mobility structures our lives but has a heavy economic, health and ecological impact
- Part 2: Why develop cycling? Making the case for the bicycle
- Part 3:You’re very kind, but my grandmother or my plumber will never ride a bike: stop the preconceived ideas
- Part 4: Cycling is the best way to decarbonize our mobility
- Part 5:Building a bikeable France
Sommaire
Bicycles are incredibly efficient for getting around
Bicycles are the most efficient machines ever created (sorry start-up nation). This was scientifically proven (see graph below). In 1973, SS Wilson wrote in Scientific American: “By converting calories into fuel, the cyclist consumes 1 liter of gasoline every 1300 kilometers!” So here is the engine of the future: 0,075 L/100 km not bad right?
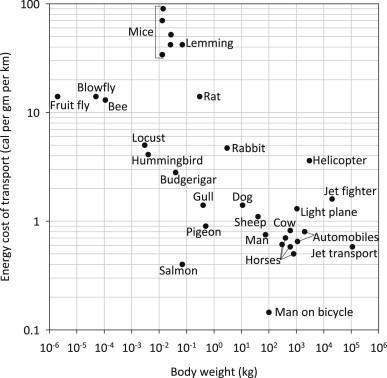
This graph shows the amount of energy (in calories per gram per km) according to the weight of each biomechanical system. The bicycle is at the bottom: it is the system that consumes the least energy for the weight it carries. Credit : R.J. Fuller, Lu Aye, 2012.
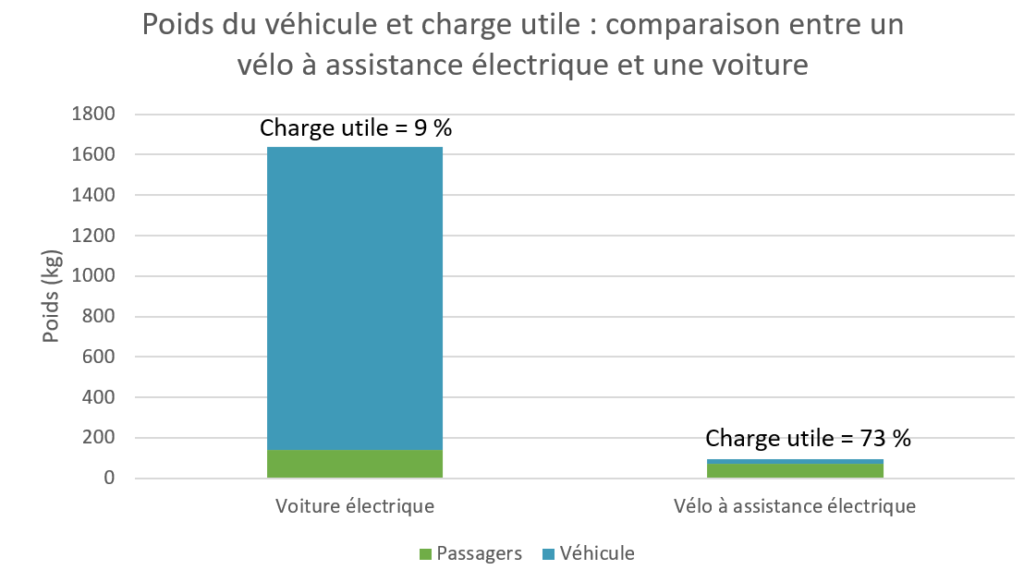
This incredible efficiency is the greatest advantage of the electric-assist bike. This is because, unlike other electrified vehicles, the energy in a bike’s electric battery is primarily used to move the person using the vehicle. Thus, the energy efficiency is very important and the ecological impacts related to the manufacturing or the end of life of the batteries are much less important compared to the benefit brought.
A minimal cost in infrastructure
Cycling is also one of the modes of transport, after walking, that requires the least infrastructure and consumes the least resources and raw materials. Although bicycle facilities are necessary when bicycles have to share public space with too many or too fast motorized vehicles, the facilities to be built are lighter than conventional road infrastructures which have to comply with drastic safety standards due to the weight and speed of the vehicles. In terms of material resources, a transport system designed around the bicycle is therefore relatively cheap. Compared to a tramway network (or even worse to a subway network that requires digging tunnels), the bicycle offers a travel capacity for much less raw materials and investments. The bicycle is therefore a formidable ally of ecology.
If we look ahead, France already has a formidable cycling network: in total, France has more than one million kilometers of roads (of which nearly 70% are small communal roads, some of which are little used). Reserving a part of this network for active travel would make it possible to build a formidable network with almost nothing!
Still, it is legitimate to wonder about the carbon impact of such infrastructure development. There is little data and full life cycle analysis for cycling infrastructure. A few months ago, BL évolution published a study that offers some answers. The carbon impact of the construction of a bicycle facility depends on several parameters (original soil, earthwork, width, materials used…). The carbon impact of a bicycle path variesbetween 70 and 380 tCO2e/km. For comparison, an analysis of greenhouse gas emissions from 16 state road projects between 2016 and 2017 resulted in an average of 6,000 tCO2e/km.
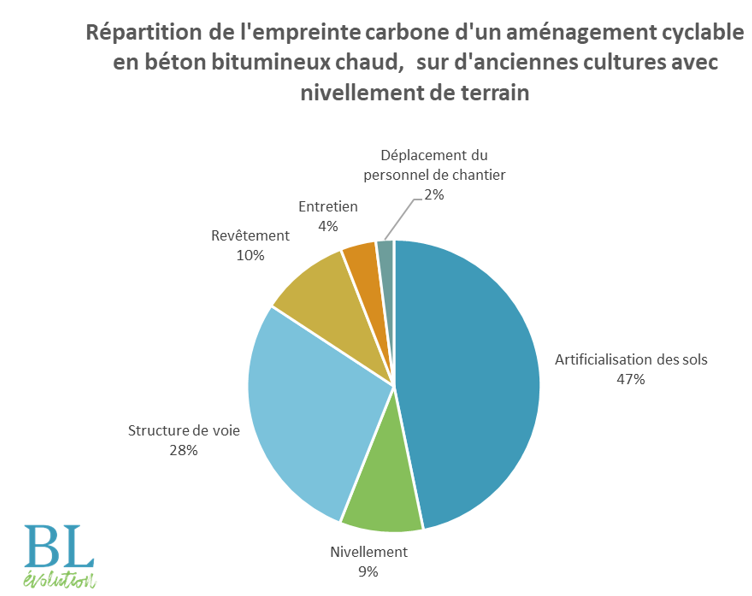
To go further, the study estimates the carbon impact of building 100,000 km of bicycle facilities. These calculations show that the construction of 100,000 km of cycling facilities by 2030 would result in between 12 and 20 MtCO2e, or between 1.6% and 2.7% of a 1.5°C carbon budget dedicated to transport in the scenario proposed by BL évolution in February 2019. As we will see at the end of this section, these results show that the carbon impact of the development of such a bicycle network is quite insignificant compared to the reduction potential associated with the modal shift to cycling that would be induced and would be amortized very quickly.

Thermal or electric car versus mechanical or electric bicycle: the CO2 match
Few complete LCAs for electric-assist bicycles (or mechanical bicycles for that matter) are available (Dave, 2010; Leunberger & Frischknecht, 2010; Luna, 2016). Results may vary slightly depending on whether the analyses take into account the rider’s power supply, the materials of the bike being analyzed (aluminum and steel not having the same impact), or the source of the electricity used in the batteries.
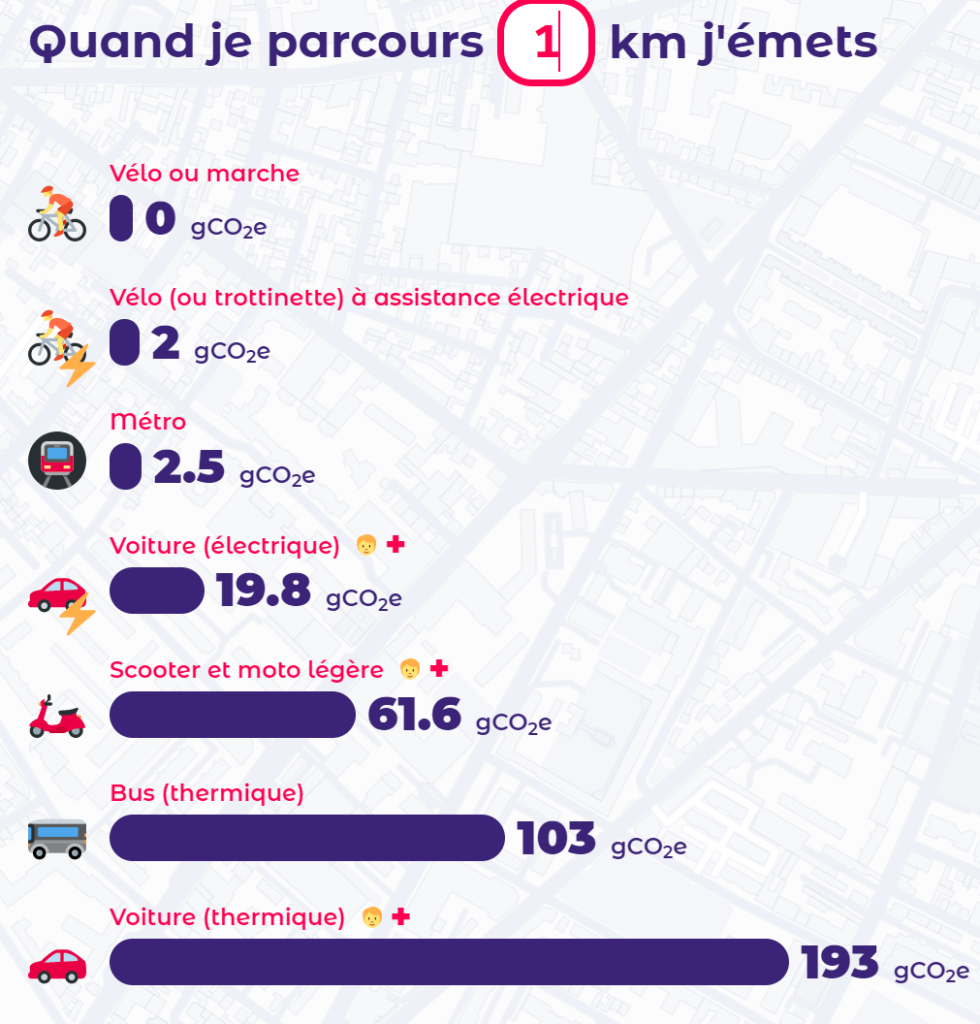
In any case, the conclusions are always the same: over the life of the bicycle (estimated at 15,000 km in the ADEME carbon base, which is low for a well-maintained bicycle but high for an EV battery), the carbon impact of the bicycle in life cycle analysis is zero or almost zero. For the use phase only, the ADEME carbon base, for France, assumes an emission factor of 0 gCO2/km for a mechanical bicycle and 2 gCO2/km for an electrically assisted bicycle. This is still 10 times less than the electric car (about 20 gCO2/km) and 100 times less than the thermal car (200 gCO2/km).
A brief overview of the potential for bicycle travel in France
Now that the energy and climate efficiency of the bicycle (and its associated modes such as the electric bicycle) is well established, it is time to go a little further: what is the potential of the bicycle? How much of our travel could be done by bicycle? This is obviously not a simple question, but one that has already been explored.
Let’s be clear from the outset that the question is not whether the bicycle can be a unique mode of travel. Even if certain adaptations of the bicycle, such as cargo bikes, allow heavy loads to be carried (for craftsmen, for shopping, for taking children to school), some journeys today will be difficult to make by bicycle. If we manage to switch to bicycles for all other trips (those that are easily transposable), this will make those trips that cannot be made by any other means than motorized vehicles all the easier and more relevant. It is therefore a question of exploring the potential for the development of everyday cycling. We know that we are starting from a very low base (less than 3% modal share). How far can we go?
First, let’s remember that work is the primary reason for everyday travel. It is in fact a structuring lever for decarbonizing travel since in most cases, the mode of transport used to go to work is identical to that used for other daily trips. This is what mobility specialists call the “trip chain”. Thus, even if we have precise data only for home-to-work trips, this allows us to reason on the scale of all our trips.
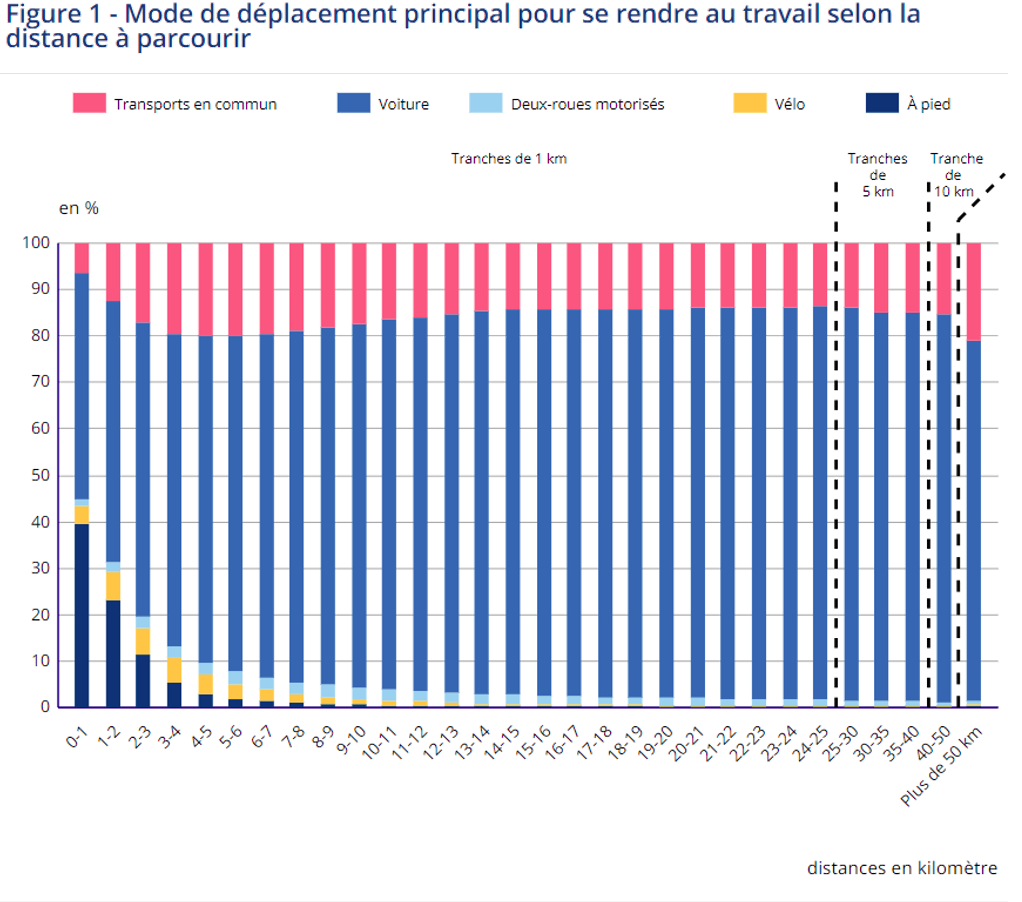
50% of trips of less than 1 km are made by car
INSEE regularly publishes a set of data showing the share of each mode of travel in French commuting. Unsurprisingly, the car holds the top spot with, in 2017, 74% of working people using their car to get to work each morning. What is more surprising is that for very short trips of less than 1 km, this rate barely drops below 50%: half of all trips of less than 1 km are made by car. For trips of more than 5 km, the car already accounts for more than 72% of trips.
The figures from the National Transport and Travel Survey make it possible to differentiate French travel by type of territory:
- Whatever the type of territory, from the isolated town in a rural area to a large conurbation, at least 20% of trips are less than 1 km long (in dark green on the graph). On average, 35% of trips are less than 1 km long.
- Regardless of the type of territory, more than half of the trips are less than 5 km long. On the whole, 73% of trips are less than 5 km long.
- Depending on the type of territory, only 5% to 25% of trips are more than 10 km long.
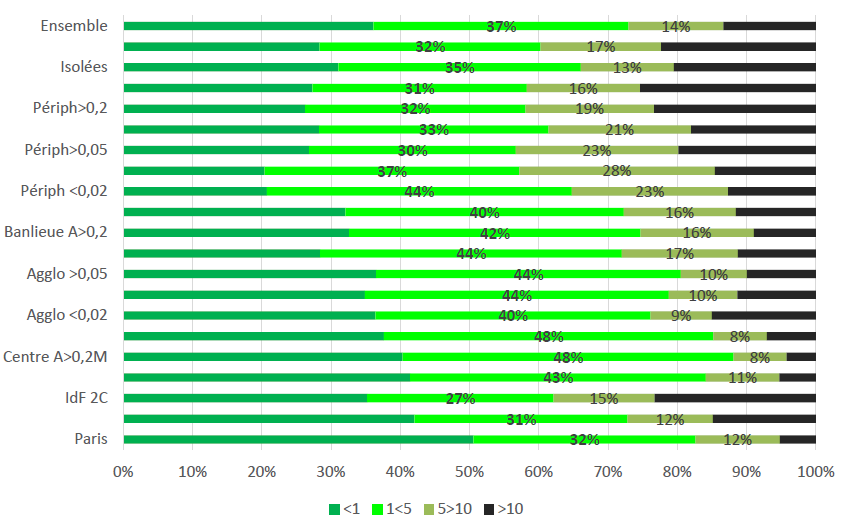
Thus, we can understand the enormous potential of the bicycle for short-distance trips: 5 km represents approximately 15 to 20 minutes of travel by bicycle, while 10 km can be covered in 25 minutes by an electrically assisted bicycle. It is therefore not a question of proclaiming the bicycle as a suitable means of transport for all journeys, but rather of realizing that it could constitute a very serious alternative for a large proportion of our journeys, particularly the shortest ones.
What is the potential for short trips (5 km = 15 to 20 minutes by bicycle)?
Let’s now look at some concrete cases. The number of trips that could be covered by a bicycle trip. As we have seen previously, it is the car system that has shaped our mobility habits for the past 70 years. It has given us access to a faster means of transport and has enabled us to travel more kilometers on a daily basis. Thus, we can hypothesize that a society where the car is less dominant would be a society where short trips are somewhat more important. It can be estimated that in such a society, the supply of employment, commerce, or housing would not necessarily be the same and would certainly be better distributed throughout the territory to avoid long distances.
Given this observation, let us now study the theoretical potential of these short trips based on the existing supply (of housing, shops, schools, jobs, etc.). Let’s first consider a territory where the low population density is not,a priori, very favorable to cycling: the Mayenne region with the Communauté de Communes du Mont des Avaloirs (16,000 inhabitants, 30 inhabitants/km2, i.e., three times less than the national average of 105 inhabitants/km2 ).
Let us now draw isochrones (circles of accessibility by bicycle) of 20 minutes around each employment and service center. At the scale of these poles, most of the motives for travel are assured (school, commerce…). We can now calculate the share of the population included in each of these accessibility circles. The result here is that in a very rural area, 71% of the population lives less than 20 minutes by bicycle from one of the centers in the area.
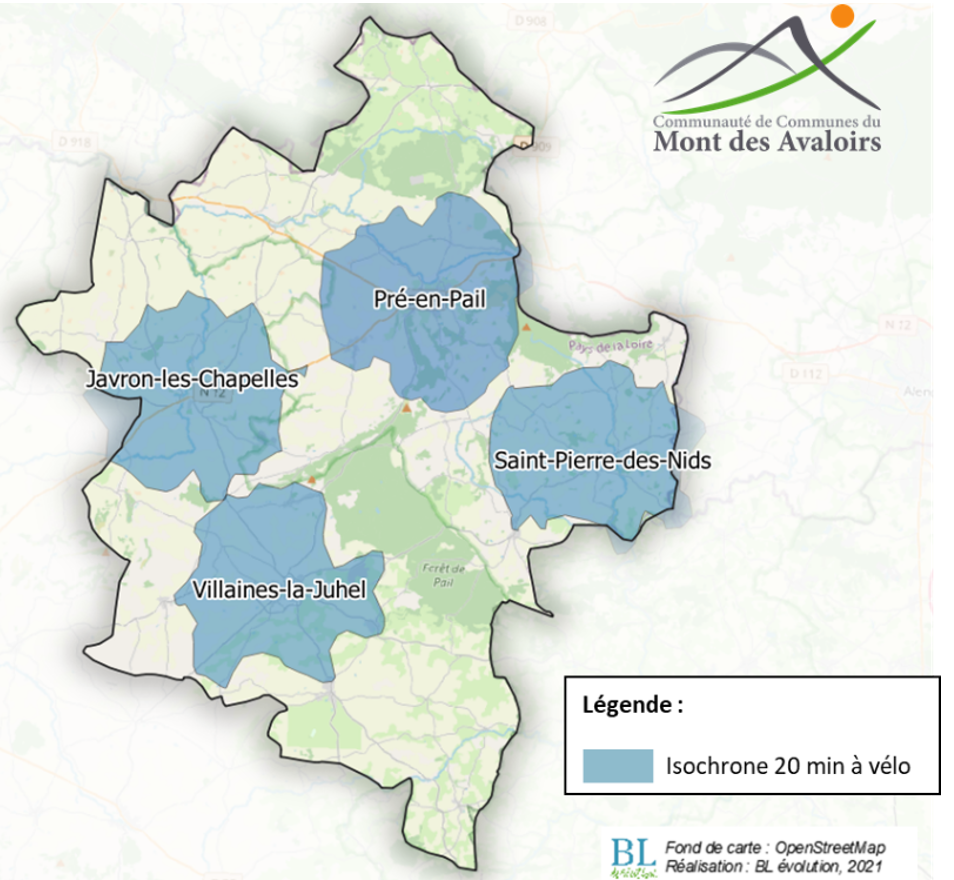
Community of Communes of Mont des Avaloirs (16,000 inhabitants, 30 inhabitants/km2). In this very rural area, 71% of the population lives less than 20 minutes by bicycle from one of the four service centers in the area. Source: BL évolution.
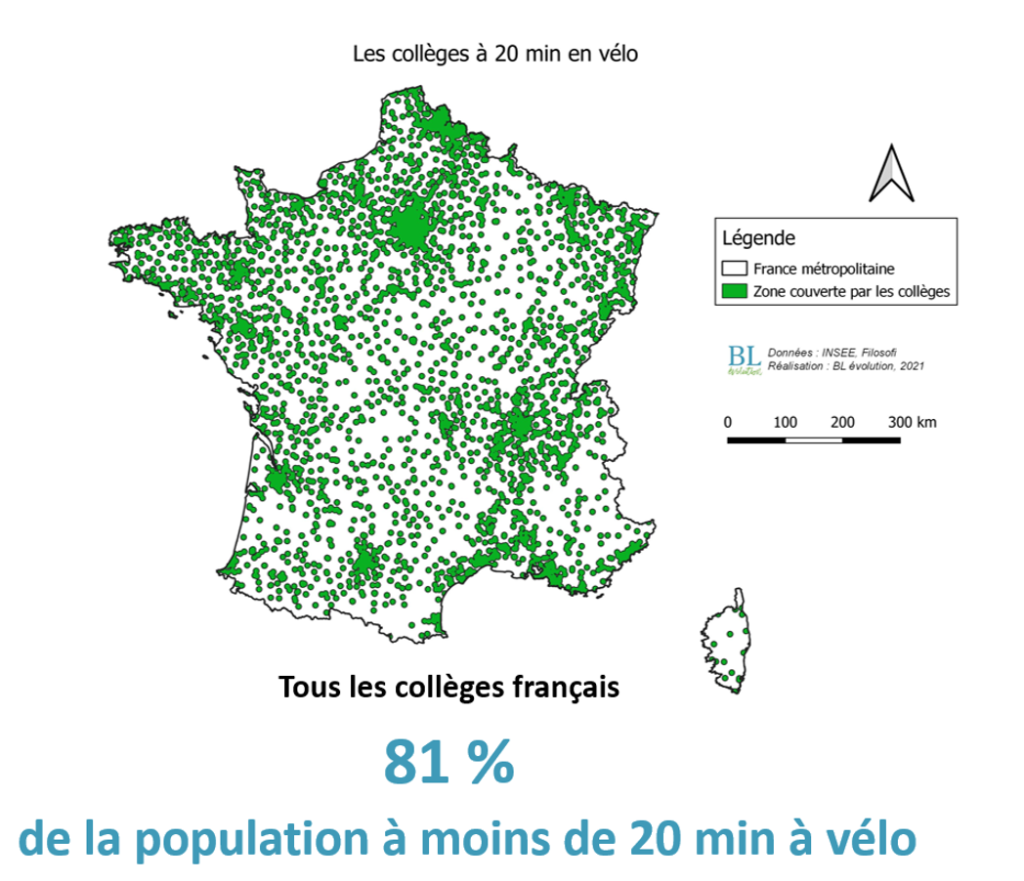
Since a particular case cannot serve as an example, I now propose to extrapolate the method to the entire French territory. The precise definition of a center of life is difficult to determine and I have not been able to find any cartographic data that would allow this type of analysis. By default, we can analyze the share of the French population that is within 20 minutes by bicycle of a college. We can then make the hypothesis that where there is a college, there is a good part of the supply of services, employment, shops, and health necessary for daily life. The result is that, nationally, 81% of the French population lives within 20 minutes by bicycle of a center of life that has a college.
Let’s be clear: this is not to say that 80% of trips could be made by bicycle, but simply to note that there is enormous room for improvement from the current situation (74% of trips made by car for 3% of trips by bicycle). These data show that aiming for a 10%, 20%, or even 30% modal share by bicycle would not be utopian!
Overview of the potential for reducing greenhouse gas emissions through cycling
Now that we have seen that the potential of bicycle travel is largely under-exploited, let’s look at the potential for reducing greenhouse gas emissions associated with the development of daily cycling in France.
A trip made by bicycle rather than by car helps reduce the number of kilometers traveled per person
BL Evolution’s studyon the ecological impacts of cycling facilities presents some estimates of the potential for reducing greenhouse gas emissions associated with the development of cycling. The real environmental impact of cycling lies in its potential to transform forms of mobility, particularly by reducing the distances traveled. To do this, it is necessary to think in terms of the number of trips or travel time rather than the number of kilometers traveled. As we saw in Part 1, the constant for nearly 200 years has been the time needed to travel (the Geurt Hupkes constant): about one hour of transport per person per day.
The speed of the mode of transport strongly influences the distance of the trips (since their duration is roughly constant whatever the mode): for a daily trip, about 10 km by car, 3-4 km by bicycle, and about 1 km by foot. Thus, a trip made by bicycle rather than by car is often a shorter trip in terms of distance traveled, which helps reduce the number of kilometers traveled per person per year. Finally, if bicycle travel increases without any change in the time spent by the French on travel, the total distances traveled and the use of the car should decrease (for example by favoring employment areas close to residential areas, developing local shops, developing cycle tourism, etc.).
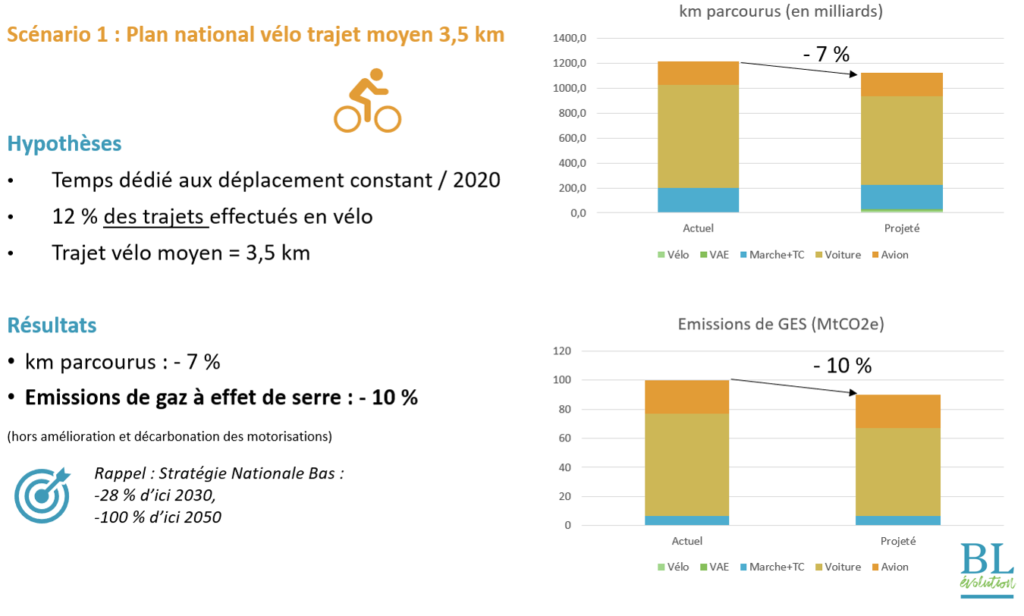
Scenario 1: The National Bicycle Plan
A first scenario consists of studying the impact of the National Bicycle Plan, which aims to develop bicycle use for short trips (about 3.5 km). The objective of this plan is that by 2030, 12% of trips should be made by bicycle (with a modal shift from car to bicycle for average trips of 3.5 km). This corresponds to a modal share in km of about 4%. In fact, even though many more trips are made by bicycle, the number of kilometers impacted is relatively small because, over this distance, the difference between a trip by bicycle and by car is relatively small. For a constant travel time, the reduction in distances traveled by car is therefore only 7%. The reduction in greenhouse gas emissions for the transport sector is around 10%. This is far from the objectives of the National Low Carbon Strategy (-28% by 2030 and -100% by 2050).
Scenario 2: average bicycle trips of 10 km
Let us now assume that a modal shift from car to bicycle takes place for average bicycle trips of 10 km. At constant travel time, this implies a reduction in kilometers traveled of about 23%. Thus, the reduction in greenhouse gas emissions from the transport sector is of the order of -31%. We will reach the SNBC target for 2030 and will get closer to the 2050 target!
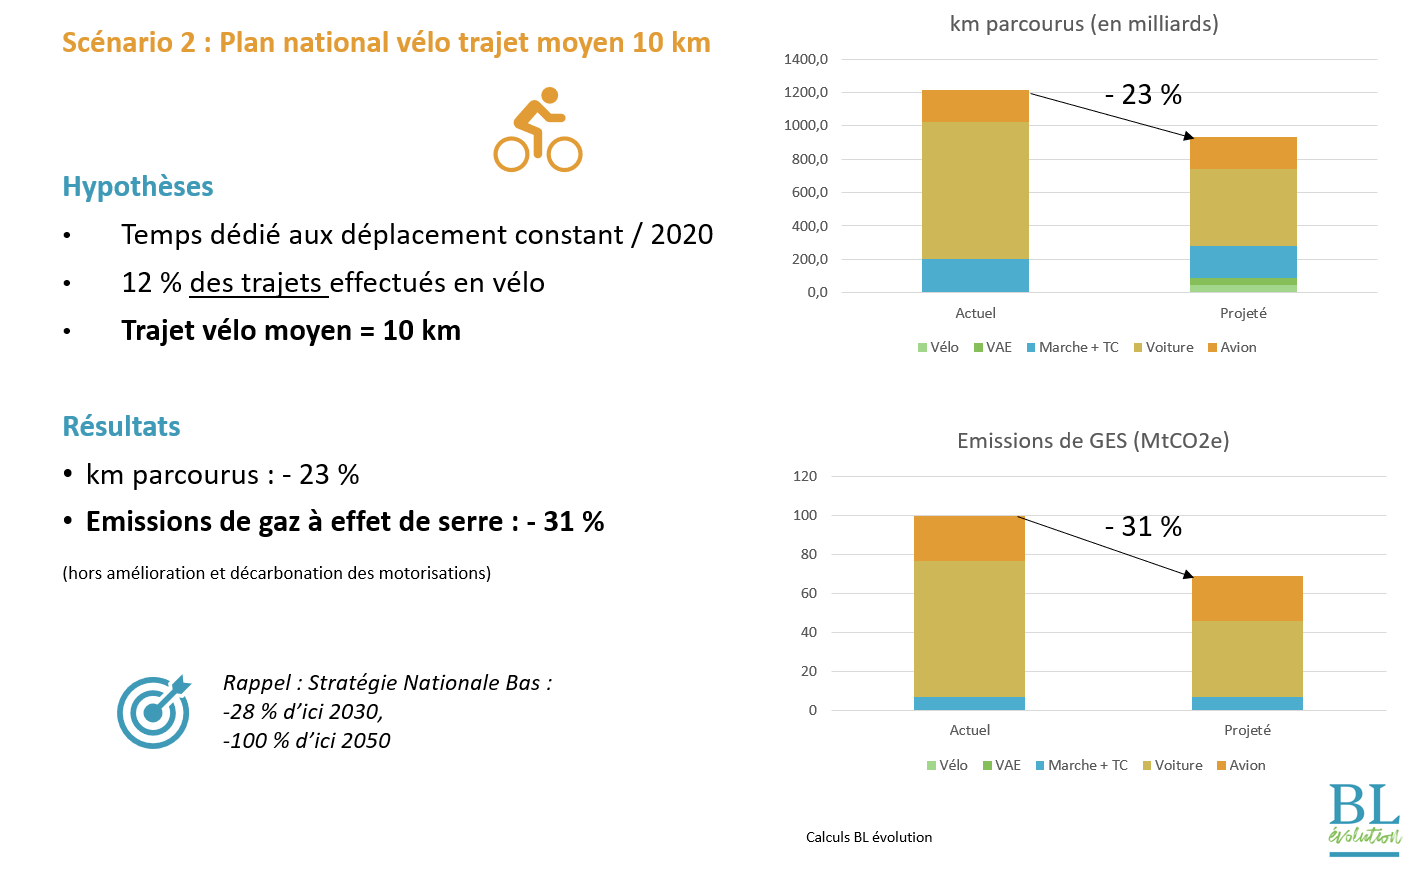
By the way, this saving of more than 30 MtCO2e per year would make it possible, in less than a year, to amortize the carbon impact linked to the creation of a complete network of 100,000 km of bicycle facilities.
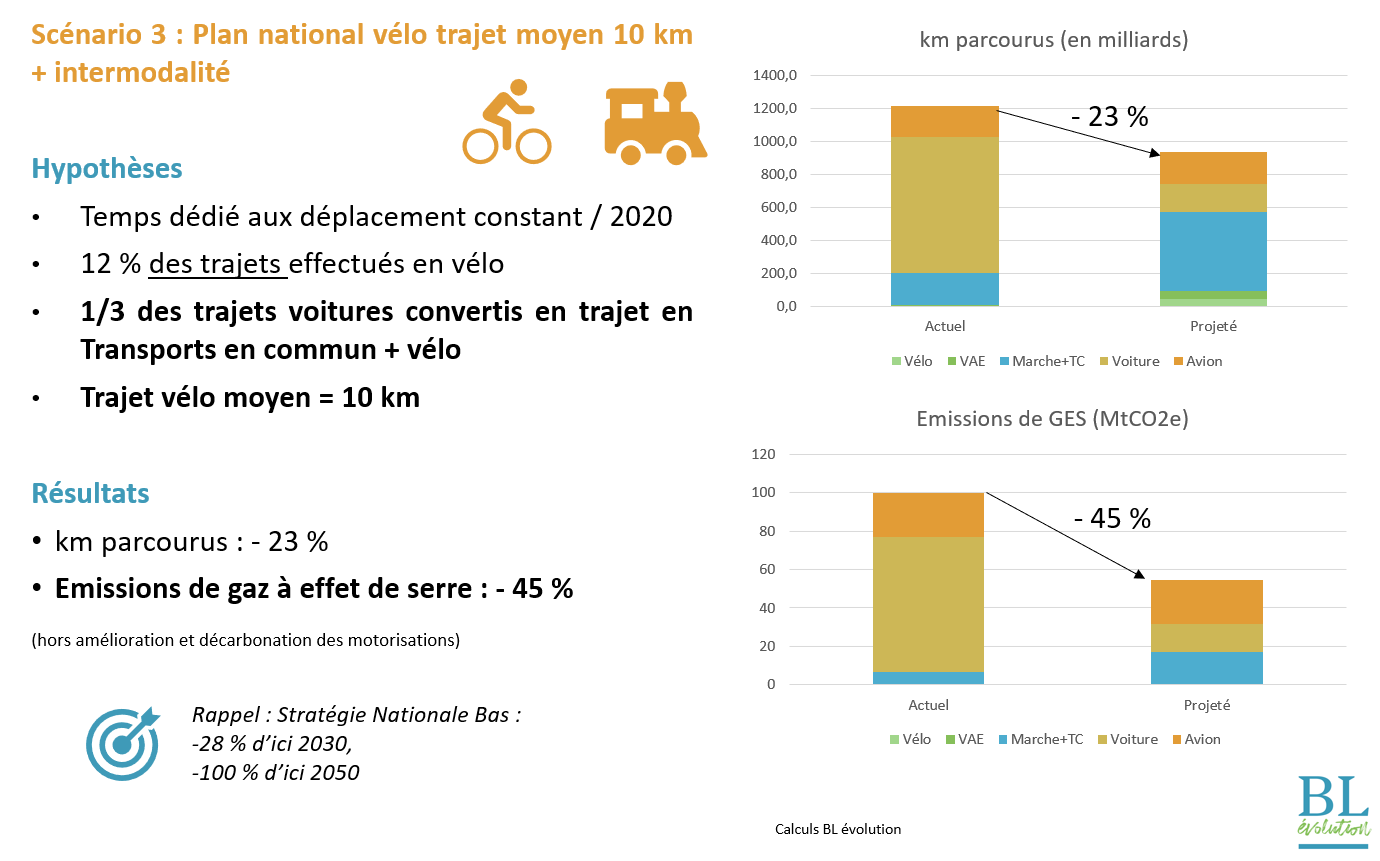
Scenario 3: Intermodality
A third scenario consists of coupling the impact of cycling with the strong development of public transport for longer trips. Let’s imagine, for example, that the bicycle is used in a rural area to travel a few kilometers before joining a bus or train for the majority of the trip. This avoids the need for a massive door-to-door public transport system everywhere, which is difficult to consider (financially but also in terms of the carbon cost of the infrastructure). In this scenario, still, with constant travel time, the reduction in kilometers traveled remains identical to scenario 2 (-23%) but the reduction in greenhouse gas emissions is more significant (-45%).
Conclusion of part 4
In conclusion, the potential for reducing greenhouse gas emissions studied here is limited to the objectives of the national bicycle plan (12% modal share). Under these conditions, we can see that cycling alone will not enable us to achieve the objectives of the National Low Carbon Strategy unless it is coupled with a strong policy on intermodality. However, its potential is largely underestimated today, as we have seen that aiming for 20 or 30% of trips made by bicycle is not at all utopian. Thus, cycling is certainly the best way to decarbonize our mobility.