A few months ago, I askedGuillaume Martin (mobility consultant at BL évolution) if he was motivated to write a few lines about cycling to be published on Bon Pote. He came back to me with almost 60 pages of content, well argued, illustrated and sourced!
To facilitate the reading, we will publish this file in 5 parts, which can be read in a row or independently from each other. After a brief introduction, you will find:
- Part 1: Mobility structures our lives but has a heavy economic, health and ecological impact
- Part 2: Why develop cycling? Making the case for the bicycle
- Part 3: You’re very kind, but my grandmother or my plumber will never ride a bike : stop the preconceived ideas
- Part 4: Cycling is the best way to decarbonize our mobility
- Part 5: Building a bikeable France
Sommaire
Introduction: from commuter mobility to bike + train intermodality
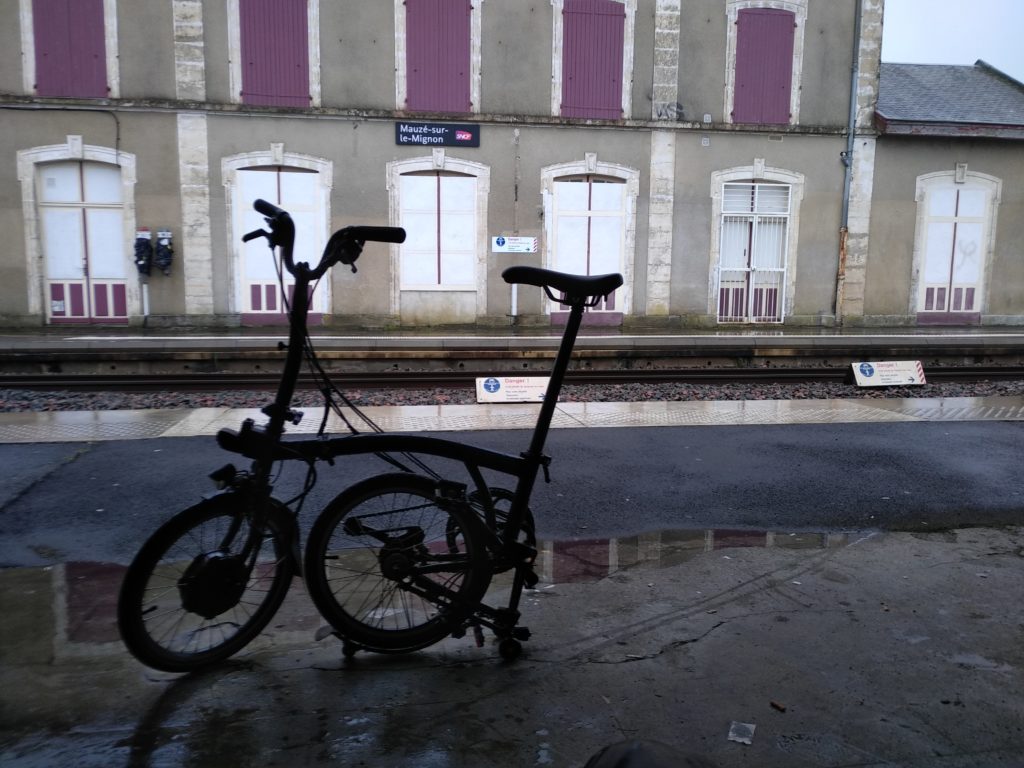
Today, the bicycle is my main means of transportation (with the train winning hands down in terms of number of kilometers traveled). It started with a few commutes and then a few vacations with friends by bike along the Canal du Midi. Now, my work trips are also done by bike (and train), all year long, everywhere in France, including in very rural areas.
I can hardly believe it today. In retrospective, I’ve come a long way since the car was a reflex for me as soon as I got my driver’s license.
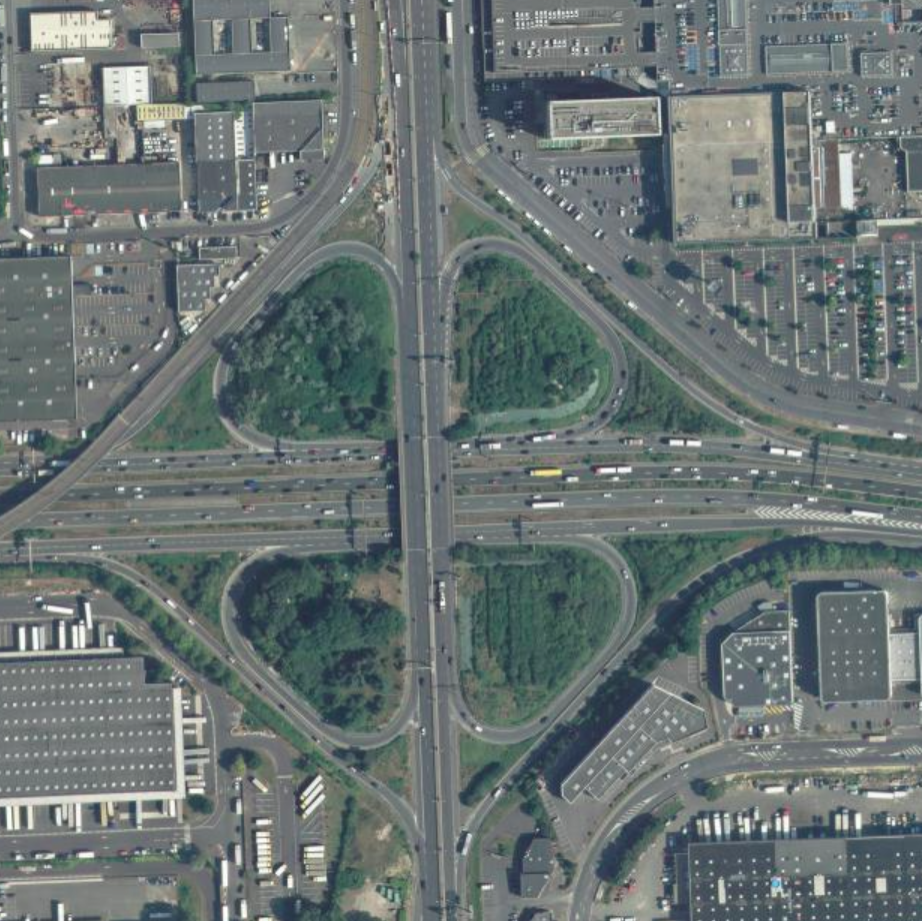
I grew up in a suburb with poor transportation links, about 15 kilometers from the Paris ring road. In spite of the high urban density of the area, everything was designed to encourage people to take their cars and nothing was really conducive to cycling on a daily basis (unless you were a fan of road interchanges, old national roads and other commercial zones built at truck height). I remember very well all those trips by car of a few kilometers (even of a few hundred meters to go get the bread!). Today, I don’t have a car but I sometimes rent one one or two times a year, systematically to carpool when there is no efficient combination of bike and train.
This transformation started about ten years ago, as I became aware of the climate crisis thanks to the association Avenir Climatique which trains citizens to the energy – climate stakes. I was then looking to transform my lifestyle to reduce my carbon footprint. I tested the bicycle for its ecological balance, I adopted it for its practicality and pleasantness.
Today, I have also made it my job within the consulting firm BL évolution which accompanies territories and companies in the necessary transformations linked to the ecological transition. I remember, less than 3 years ago, the look on the faces of some elected officials who saw me disembarking in the middle of Auvergne on a bicycle in the parking lot of the town hall filled with SUVs. Some of them found it hard to believe that a consultant from Paris could come to them by bike and train to talk to them about the climate or cycling. At the time, the reception was not always very friendly. When I talked about cycling in certain areas, people laughed at me or thought I was crazy despite the figures and arguments. Today, the momentum is there: all regions want to become bikeable, the bike is finally taken seriously as a full-fledged mode of transportation that is not reserved for the unemployed or for environmental fanatics.
In this series of articles, I will try to share with you a big summary of several years of research and reflection around mobilities and cycling. The first part explores some data and general elements about French mobility, its constraints but also its impacts on the whole society. In part 2, we look at a number of arguments in favor of cycling: health, economic, social… In part 3, I propose to deconstruct a number of preconceived ideas about cycling. Part 4 focuses more specifically on the climate issue, on the excellent power of cycling to reduce greenhouse gas emissions and on the total potential of trips that can be made by bicycle in France. Finally, in part 5, I present some ideas and orders of magnitude for building a France that can be cycled and thus contribute to the objectives of carbon neutrality.

Mobility structures our lives but has a heavy economic, health and environmental impact (1/5)
Mobility is an activity in its own right that has undergone profound changes over the last century
The first thing to understand when thinking about mobility issues is that mobility is an activity in its own right. It is often forced and experienced as a constraint: (distance to work, land use planning…). There is no shortage of reports, studies and data dealing with mobility. Among the most interesting sources to mention is the National Transport and Travel Survey, which consists of a vast survey of all modes of travel. It is the most complete data set available in France. Unfortunately, the latest data date from 2008 (the update is in progress and should be released within the year).
By playing around with the data, we can see that the French travel an average of 35 km per day by car. Without counting the construction of vehicles, roads and the operation of hospitals to manage the induced accidents (among other indirect impacts), this represents 1.2 tCO2e per year per French person, which is more than half of our individual CO2e budget in a France that would respect carbon neutrality.
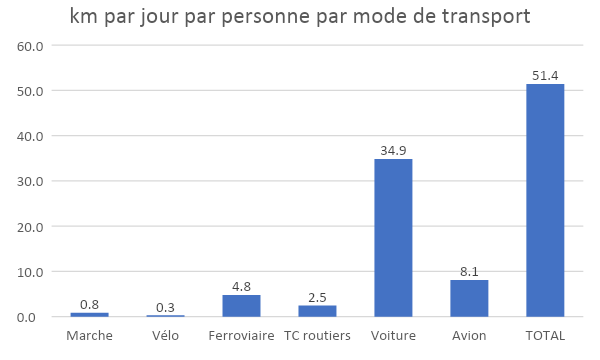
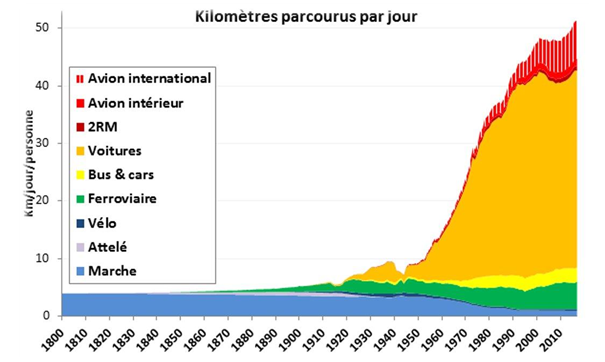
At the same time, you can see that walking and cycling, which were in the majority before the middle of the last century, are now very much in the minority. Historically, the shift from a predominantly foot-based mobility to a car-dominated mobility has been achieved by replacing trips of about 1 km on foot with trips of about 10 km by car. This has led to an explosion in the number of kilometers travelled per person. Could the bicycle do the opposite?
Even if travel modes change, the number and duration of trips remain constant
The other most interesting data concerns the number of trips made per day and the time spent by the French on travel. For nearly 200 years, the number of trips per person per day has been between 3 and 4, whatever the mode of travel.. We can also consider that even if the modes of transport have evolved, the constant is the time needed to make a daily trip : on average between 15 and 20 minutes whatever the mode of transportation (excluding the time needed to access public transport) and about an hour of transport per day per person on average. What has changed dramatically with the development of motorized modes is the travel distance induced by access to a faster mode of travel (and conversely, the greenhouse gas emission reduction potential of bicycle-based mobility, as discussed in Part 4).
Another interesting source is the Mobile Lives Forum Report. It shows that 30% of the population performs all of its activities within 9 kilometers of its home (excluding social activities) and can therefore potentially do without the car on a daily basis. This would not be without consequences on our national greenhouse gas emissions (we will see this in more detail in part 4)!
City or country: different modes of travel but similarities far from preconceived ideas
Contrary to what is usually said, people do not travel less when they live in a dense city than when they live in the countryside. The survey shows that there is no relationship between the density of an area (number of inhabitants per km²) and the amount of travel. The importance of travel is primarily explained by the size of the city in which one lives: travel times and distances are shortest in medium-sized cities, between 10,000 and 50,000 inhabitants. These results call into question the ideal of a metropolitan model that, organized around a dense city, would reduce travel for its inhabitants.
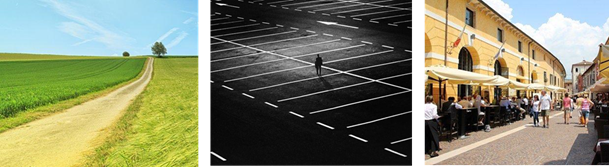
These results also show that what changes between the city, the countryside and the suburbs is the perception of distances. Indeed, this perception is often quite irrational and depends more on the environment crossed than on the actual distance to be covered. For example, an urban journey of several kilometers may seem quite accessible on foot or by bicycle in a dense, continuous urban fabric where the path is easy (wide sidewalks, bicycle facilities…) and where there is life on the way (shops, people in the street…). On the contrary, we tend to lengthen our perception of distances and travel times when we cross deserted, austere or very hostile environments (in the countryside on the edge of a country road, in the middle of shopping areas or on the edge of expressways…).
NB: Our relationship to time and distance will be discussed in more detail in parts 3 and 4 of this article.
The main issues related to our daily mobility
A social issue: the richer and more educated we are, the more we travel far, often and quickly.
Mobility is above all a social issue. It allows us to move around on a daily basis, to give our vaccinated grandmother a kiss, to go to work, to see our friends. It is the link that unites us and allows us to be social. The confinements have shown us to what extent our mobility habits are structuring our lives and our social habits. As we will see later, focusing on everyday local travel is also a measure of social justice. According to the Mobile Life Forum, the richer and more educated people are, the further, faster and more often they travel.
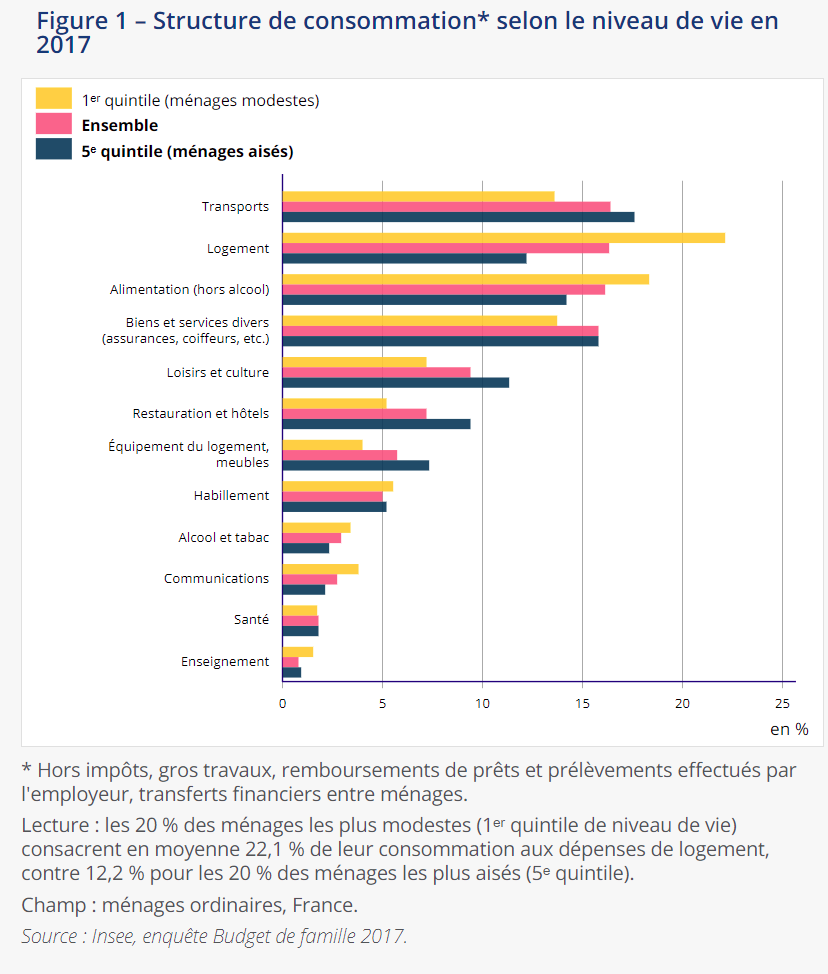
An economic issue: the number one consumption item for households
Mobility is an economic issue and a cost for households. According to INSEE, it is the number one consumption item for all French people (16% of the household budget, i.e. an average of €4,500).
A climate issue: the leading emissions item in France, the least successful in decarbonization
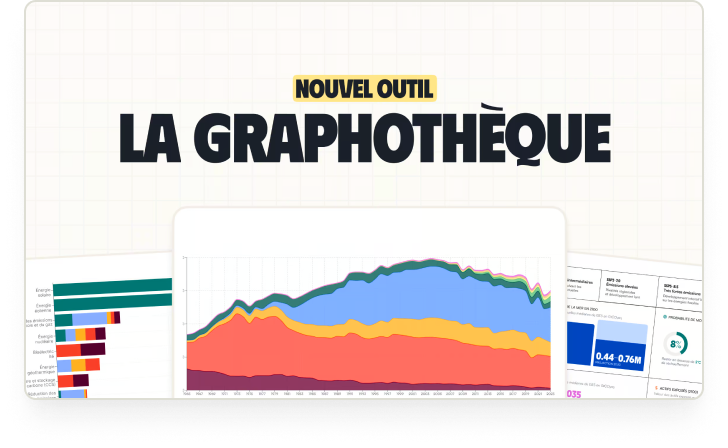
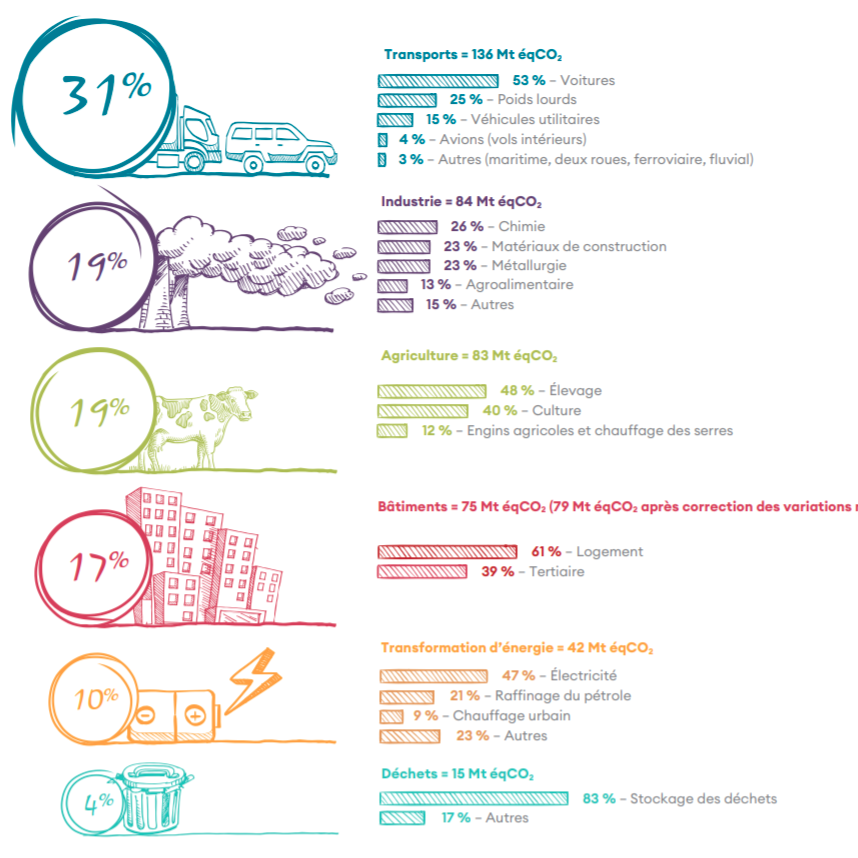
The transport sector is the largest source of greenhouse gas emissions in France, with nearly 136 MtCO2e in 2019, i.e. nearly 31% of national emissions, according to the French High Council for the Climate. However, there is one nuance: the transport sector includes the mobility of people and the transport of goods. In this article, we will focus on the mobility of people, which represents more than 60% of the sector’s emissions (in the graph below, we can add up cars and a part of the commercial vehicles that are not used to deliver goods).
NB: The freight transport sector would deserve an entire article. Cycling with cyclologistics also has its role to play in this sector, especially in the delivery of the last kilometer, as this recent study has shown.
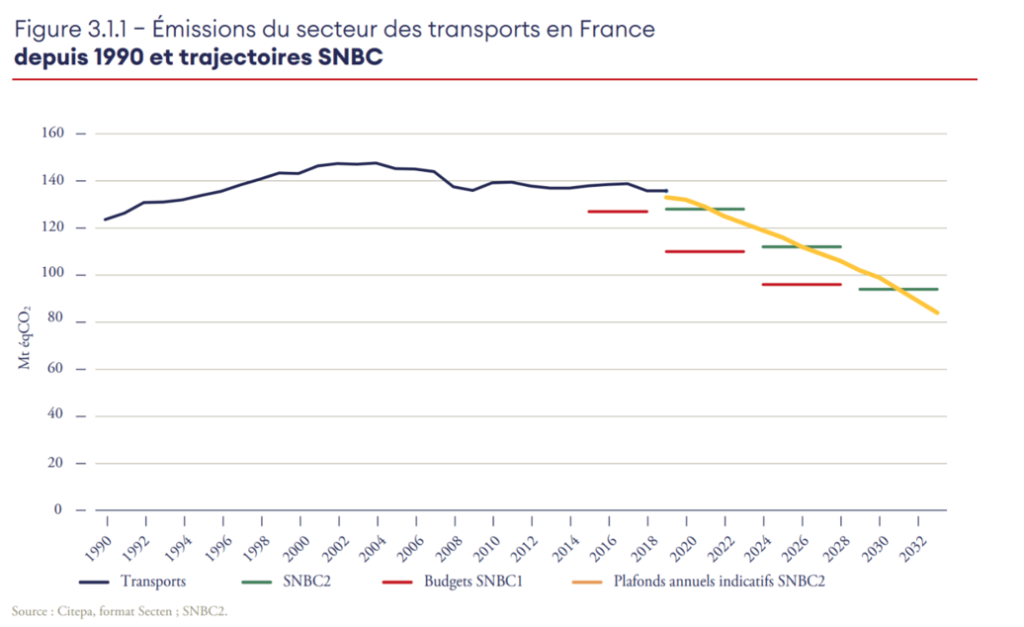
Even more worrying is that the transport sector is the worst performer in the decarbonization process. According to the latest report of the High Council for the Climate, it is the sector whose emissions are the most “out of control” and the least aligned with the objectives of the National Low Carbon Strategy (NLCS): ” Compliance with the NLCS trajectory for the sector requires a strong acceleration of the pace of emissions reductions. The first sectoral carbon budget for the period 2015-2018 has been exceeded by 43 MtCO2e. […] While the NLCS targets an annual reduction rate of between 3 MtCO2e and 4 MtCO2e over the period 2021-2030, it was only 0.7 MtCO2e/year over the period of the first carbon budget. ” More simply, we can remember that the transport sector would have to decrease its greenhouse gas emissions 5 to 6 times faster than today to align with the objectives of the National Low Carbon Strategy.
This is the harsh reality of the figures. Despite the constant hype for electric vehicles, fleet renewal is a long process. In 2020, 8.2% of vehicles purchased in France were electric, a percentage that is up sharply from 2019 (1.9%) but still too low to make a structural difference, since a vehicle has an average lifespan of 10 to 15 years. Put another way, if 100% of vehicles sold were to be electric (or low-emission through other processes), it would take at least another 10 years before the sector was fully decarbonized. In France, a ban onthe saleof combustion engine vehicles is not planned before 2040, whereas the European Union recently announced that it was working on a target date of 2035. Other countries are already more ambitious, such as Denmark (2025), the Netherlands, Sweden and the United Kingdom (2030).
An energy challenge: the sector most dependent on fossil fuels
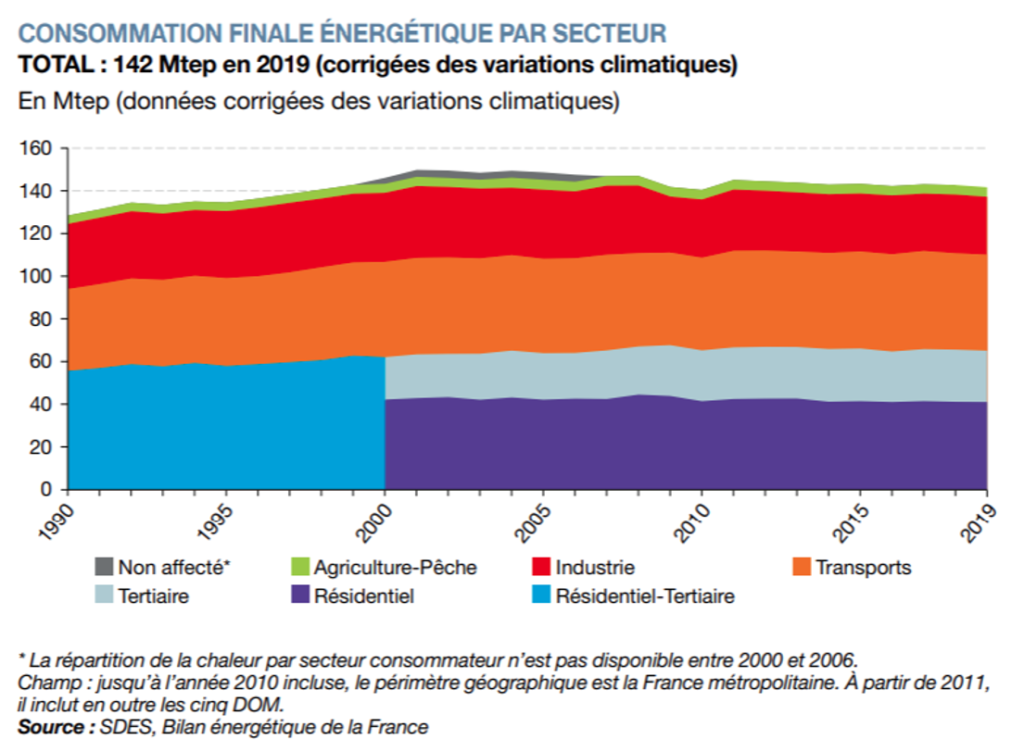
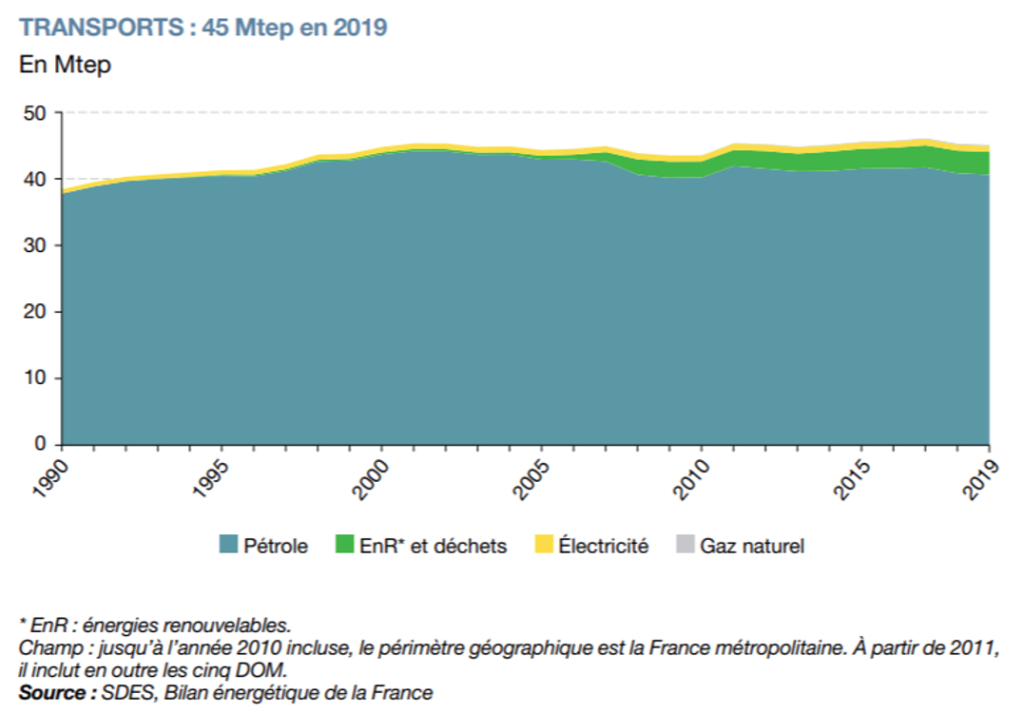
The transport sector is also the leading sector in terms of energy consumption. Final energy consumption for transport purposes will amount to 45 Mtoe (million tons of oil equivalent – that’s a lot) in 2019. After increasing in the 1990s, it has remained relatively stable since the beginning of the century. .
Nearly 90% of the energy consumed in transport is of fossil origin (mainly oil). We are still a long way from the dreams of all-electricity or hydrogen(the rest is completed, in 2019, by 8% of biofuels and 2% of electricity). Obviously, all of this fossil energy consumption makes us very dependent on producing countries, weighs on household and business budgets and weakens our economy. In 2018, the associated expenditure is €71 billion according to the CGDD. Although subject to non-negligible price volatility risks in the short term, there is no risk of depletion of oil resources in the medium to long term that would allow us to rely on a decrease in supply to bring about a radical change in the energy mix. Thus, the decrease in fossil fuel consumption, which is a sine qua non condition for decarbonization of the sector, must come from a decrease in the demand for oil fuel.
A health issue: a deadly toll
The transport sector is also one of the main contributors to air pollution. In 2019, road transport accounted for 12%, 54% and 40% of average emissions of fine particles PM2.5, nitrogen oxide (NOx) and soot carbon respectively. According to Santé Publique France, this air pollution is responsible for 40,000 deaths each year. In terms of economic impact, the Senate’s Commission of Inquiry on the economic and financial cost of air pollution estimated the total cost of these nuisances at between 68 and 97 billion euros per year, a large part of which is linked to health impacts
Our mobility system, which today relies heavily on the car, leads to a significant sedentary lifestyle. In 2014-2016, in France, only 71% of men and 53% of women reached the WHO recommendations for physical activity according to Santé Publique France.
Transportation is the main source of noise in our public space. A recent study by the ADEME, the French Environment and Energy Management Agency, estimates that the health consequences related to noise amount to 156 billion euros per year, of which more than half is due to road transport alone (52%). This financial assessment mainly takes into account health costs but also real estate depreciation and costs related to noise prevention.
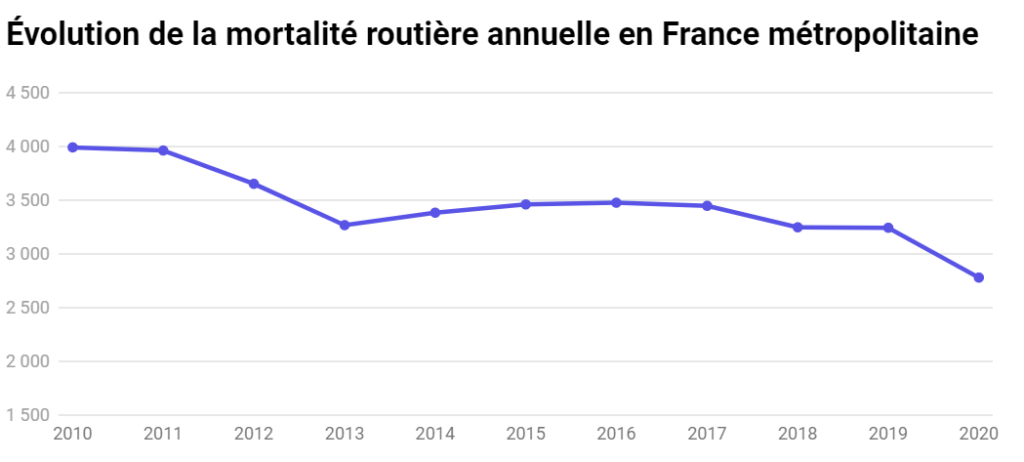
Finally, it is difficult to discuss mobility without recalling that roads and motorists kill about 3,000 people a year in France, putting our country at the bottom of the European picture. This is an impact that is completely under-reported and strangely tolerated in our society. In comparison, terrorism responsible for about 500 deaths since 2000 has caused 120 times fewer victims than road accidents. TheBrétigny-sur-Orge accident (the last big railway accident in France) caused 7 deaths (430 times less than a year on the roads).
Conclusion to Part 1
Mobility is therefore a central issue in our lives, and has undergone profound changes over the course of the century that suggest new revolutions in a context that is changing, particularly because of the climate emergency. Mobility structures our daily lives and is a complex subject to study. Strongly organized around the car, our mobility today has significant social, economic, ecological and human impacts.
In part 2, we will see that the bicycle responds to several of these issues.